

If you like heading into a baseball season being all but certain you know what's going to happen, then 2017 was the year for you.
Prior to Opening Day, MLB.com polled 50 writers for predictions, and the answers were clear: Red Sox, Indians and Astros in the AL, and Nationals, Cubs and Dodgers in the NL. FanGraphs did the same thing with 54 of their own writers, and they came up with an identical list of six: Red Sox, Indians and Astros in the AL, and Nationals, Cubs and Dodgers in the NL. Baseball Prospectus? They came up with the same set of six. So did CBS. So did ESPN. So did Yahoo. So did, overwhelmingly, the staff of The Ringer. You had to try hard to come up with something different.
Here's how the 2017 season actually turned out: Red Sox, Indians and Astros in the AL ... and ... well ... Nationals, Cubs and Dodgers in the NL. Four of the divisions were taken by at least 10 games. Two were taken by at least 20 games. By early August, you had headlines decrying the complete lack of drama.
Sometimes you can predict baseball, apparently. Score one for the projections.
Now: Can you do the same for 2021? We'd argue you can't. Not even close.
Think about it. In the NL West, the Dodgers look great, but so do the Padres; this could be as good a race as we've had in years. The White Sox have loaded up, but the Twins are still strong. The Braves are the three-time defending NL East champions, yet the Mets have made some big adds. Look at the AL East, with the Jays making big moves, the Rays the defending AL champions and the Yankees probably with the best roster. Look at the AL West, with the Springer-and-Cole-and-Verlander-less Astros wondering if the Angels finally have the pitching to support Mike Trout. Look, even, at the middling NL Central, which is unlikely to have any particularly strong teams, and thus should have some good competition.
This is going to be pretty much the opposite of 2017 -- or 2018, which had a similar issue. This year looks like it might have the most interesting division races we've had in years, really. Can we quantify that? Well, sure. It's 2021. It's baseball. We can try to quantify just about anything.
* * *
Here's how we'll do this. We really do need projections, not outcomes, because we're trying to compare how things looked headed into a season, not at the end of one.
To that end, FanGraphs's Dan Szymborski, the creator of the ZiPS projection system, was kind enough to supply us with preseason projections for each season from 2005 through 2020. We then took the 2021 projections from FanGraphs, and for each season, we started by looking at how many of the six divisions had a projected winning percentage gap of .030 or less -- about 4.8 wins over a full 162 game season -- between the top projected team and the second-place team.
So for example, in 2021, as of Tuesday, the Twins have a .547 projected winning percentage, and the White Sox are at .540, a razor-thin margin. Five of the six divisions -- only the Yankees, with a large lead in the AL East, are the exception -- have a gap of .030 or less between the first and second-place teams. There were only four such tightly projected divisions total from 2017-19. Year over year, it looks like this:
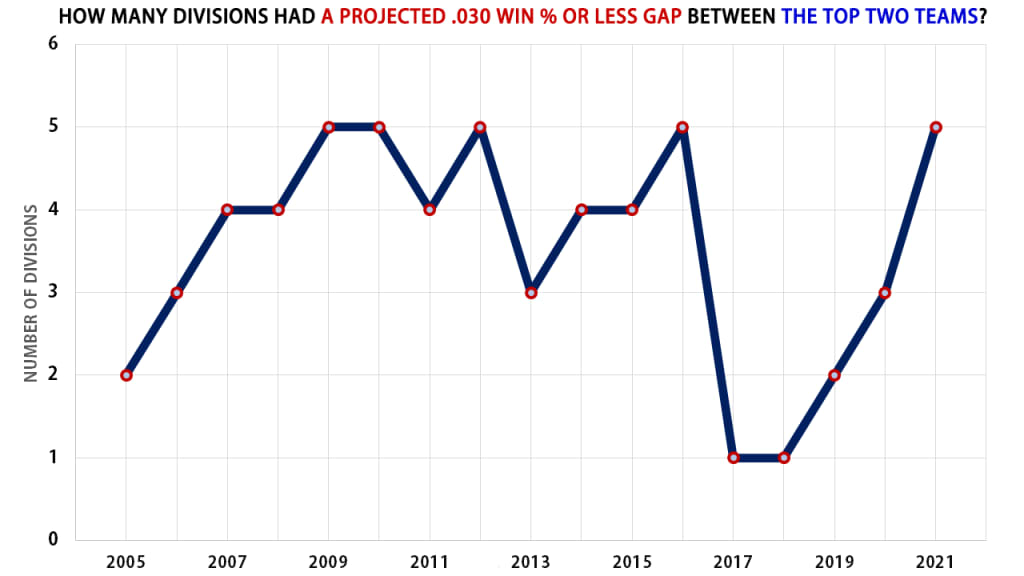
So by that reckoning: Yes! We've not seen such a tightly packed set of division races since way back in 2016, when every division except for the NL Central was projected to be close. (The Cubs were projected to mash the Cardinals and the rest of the Central, and that they did.) It has been quite some time since we've entered a season this way.
Nor, potentially, is this a one-year blip. It's been steadily climbing since a back-to-back 2017-18 of a mere one "competitive division," which now looks like it was itself the fluke. (In 2017, the Nationals -- projected 89-73, .549 -- were viewed as healthy-not-overwhelming favorites over the Mets -- projected 85-77, .525 -- and in 2018, the Yankees were a slight favorite over the Red Sox. "The only drama of the 2018 MLB season will be in the AL East and wild-card races," blared a Washington Post headline.)
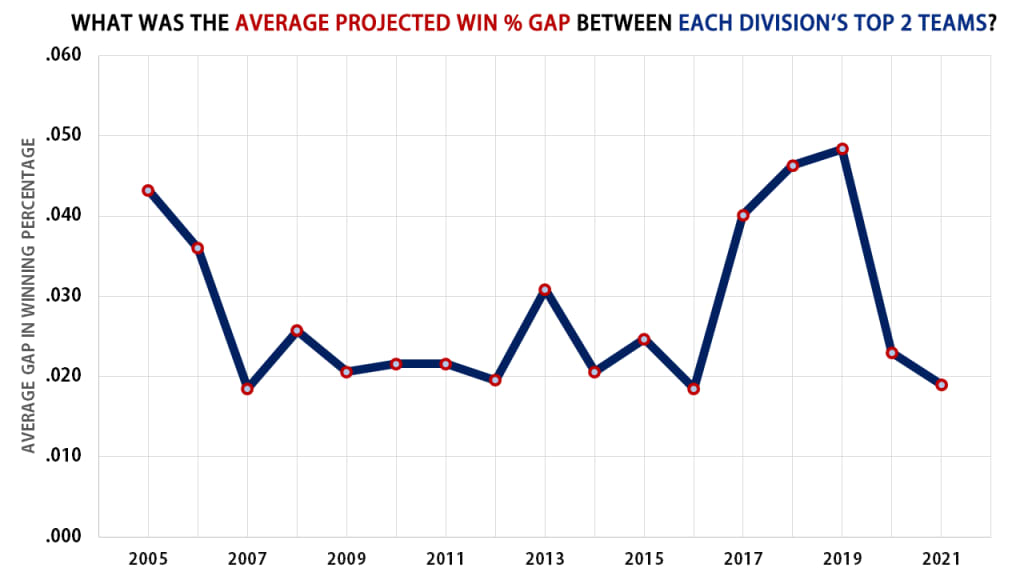
Let's look at it a different way. Instead of just looking at "number of close divisions," what if we take the gap between the first and second-place team in projected winning percentage in each division -- so for example in 2021, that's .007 between the .547 of Minnesota and .540 of Chicago, and .026 between the Astros and Angels, and so on -- and just try to find the smallest average gap? That is, we used .030 as our "close or not" line above, but a gap of .031 (what the 2014 Nationals were favored to edge the Braves by) is certainly different than a gap of .080 (what the 2017 Cubs were favored to beat the Cardinals by).
A similar story emerges. The outliers here, aside from the very first year in 2005, were 2017-19. It got more "normal," as compared to 2006 through 2016, in 2020. Now, 2021, with an average first-vs-second gap of .019 (just over three wins in a full season) is tied with 2007 for the smallest gap in projected winning percentage between the top two.
That's great news if you like division races, especially if the postseason structure changes in the future. But ... why? Were the last few years just a fluke? Maybe. But not entirely.
We are, importantly, talking just about thrilling division races at the top, not evaluating the top-to-bottom strength of those divisions. Starting around 2016, you'd begin to see articles talking about "super teams," pointing out that the best teams -- usually referring to the Dodgers and Astros, sometimes the Yankees, Indians, Nationals and Red Sox, and at first, the Cubs -- were wildly loaded in talent. As Jeff Sullivan, now a Rays analyst, then writing at FanGraphs, noted headed into 2018:
"I don’t know how we define a 'super-team era,' but it sure feels like we’re in one," wrote Sullivan. "At the moment, seven teams are projected to win at least 90 games in the season ahead. Just about every division appears to have a clear favorite, with the exception of the AL East, and that one’s only unclear because two teams are really good."
Exactly, and he understated it; as it turned out, 11 teams won 90 or more games that year. We still have those elite top-end teams today, because it's difficult to look at the Dodgers, Padres and others and think they aren't "super teams," no matter how you define it. (A different projection system than the one we're using today, Baseball Prospectus's PECOTA, has the 2021 Dodgers projected to go 103-59. Los Angeles does not currently have a third baseman.) That's still true, but now they have competition.
Part of this is simply about timing, about realizing you can't just wait for the Dodgers and Yankees to stop being good. You have the Mets with a new, highly motivated owner. You have a pair of teams coming out of long rebuilds and finding the time is right to strike in the Padres and White Sox. You have a Toronto team that has an elite young core of hitters all arriving at the same time. That part seems to be specific to 2021.
But the flip side of this is that there are only so many games to be won, and if you have a few great teams gobbling up the wins, you have to have teams on the other end, and we've had too many of those. In 2019, for example, there were four 100-win teams, and four 100-loss teams. The 2019 Yankees won 17 of 19 games against the Orioles. The team with the best run differential that year (Houston, which outscored its opponents by 280 runs) topped the team with the worst run differential (Detroit, which was outscored by 333 runs) by 613 runs, the second-largest gap in history.
One way to look at how spread out the projections are between top and bottom is to look at the standard deviation of projected wins, which measures the spread of data around the mean. The short version of that is: a lower standard deviation means that the projected wins are more clustered around one another. A higher number means a much larger gap between top and bottom. Guess what had been happening over the last few years:
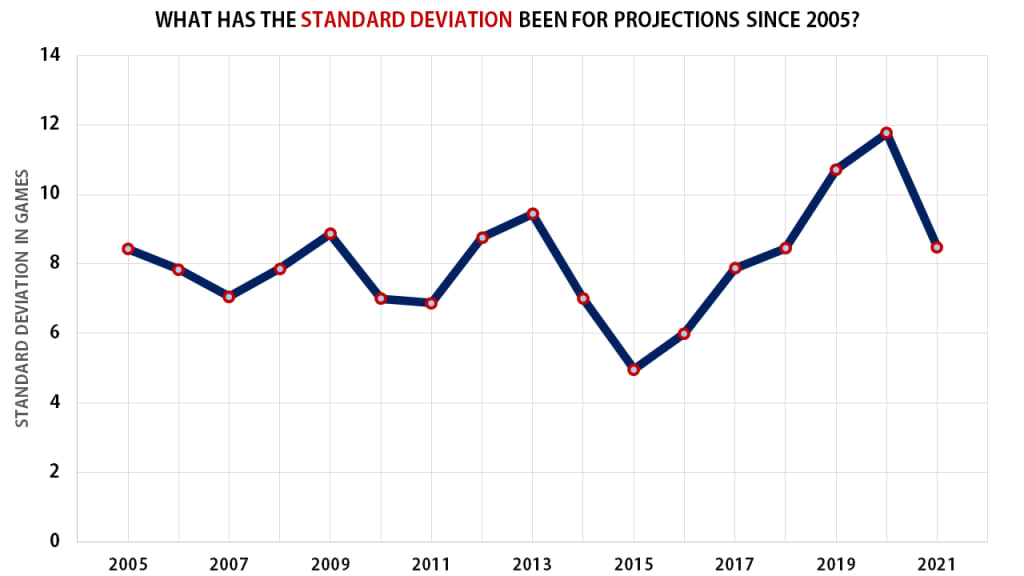
From 2005 through 2013, we had plenty of consistency, with the average standard deviation being eight wins. (That means, oversimplified, that roughly two-thirds of teams were projected within eight wins of one another.) That dropped in 2014 and '15 before beginning a steady upward climb for the next five years, with 2019 (nearly 11 wins) and 2020 (nearly 12 wins, given a full schedule) having the widest spreads on record. As we look to 2021, that's dropped back to a standard deviation of 8.5 wins. We don't think that's because the bad teams will be less bad; there are eight teams projected to have a .475 winning percentage or worse, which is about the average we've seen over the last 15 years.
Remember: It doesn't mean this will actually happen. Projections, famously, are not predictions. The 2018 season that had seemed so easy to look ahead to ended up with the Red Sox far outpacing the favored Yankees, and the heavily favored Dodgers and Cubs each having to play one-game tiebreakers at the end of the year, having finished tied atop their divisions. You'll surely come back to this article in October and point out how "actually, the Cardinals won the Central by seven games," or "the Mets collapsed again and the Braves won the East easily." That's all possible, perhaps probable.
But 2021 already looks different than the last few years. It looks like we're going to have races. Potentially lots of them. Potentially some really good ones.