

Well, we knew this was going to be weird. And boy, did the 2020 MLB regular season deliver.
Limited as it was to 60 games per team, this season was bound to present a slew of silly statistics and absurd outliers. Let's celebrate that strangeness here in this collection of 20 bonkers stats for 2020.
We are focused on full-season trends here, not the history that was made in individual games (that could fill an entire piece on its own). All stats are through Wednesday's play.
.821
The Twins' home winning percentage (23-5), which would be the best all time, depending on how they fare at Target Field against the Reds this weekend. The best home team of all time was the 1932 Yankees, who went 62-15 for an .805 winning percentage. The Twins have done this sans fans in the stands, so, clearly, they feed off some especially supportive cardboard cutouts.
.733
The Dodgers' road winning percentage (22-8). With their road slate complete, this mark stands third all time, behind only the .797 road winning percentage of the 1906 Cubs and the .740 mark of the '09 Cubs.
As for their overall body of work, the Dodgers entered Thursday with a .696 winning percentage (39-17) that would rank 11th in the modern era (going back to 1901), and, in a normal year, would be a 113-win pace.
107
Speaking of the Dodgers, this was their MLB-leading home run tally, entering Thursday. Their rate of a home run every 17.9 at-bats would surpass last year's Yankees (18.3) for best ever. But to really put the Dodgers' output in perspective, consider this: The 1988 World Series championship team hit just 99 home runs in 162 games!
.200
Road winning percentage for the Pirates (5-20) and the Rangers (6-24) -- tied for the sixth-lowest in the modern era and the lowest since the 1945 Philadelphia A's put up a .171 mark. The Pirates still have three road games in Cleveland this weekend. The Rangers' status is cemented. In fact, the club only won four games outside the state of Texas (and two of those wins were in Coors Field)!
.411
Winning percentage for the Nationals, entering Thursday. Barring a weekend surge, they will finish with the second-worst winning percentage for a defending World Series champion. Only the 1998 Marlins (.333) were worse.
If the Nats and Astros both finish with losing records, it would mark just the fifth time that has happened to both World Series participants from the previous year. The others: 1965 (Cardinals and Yankees), '67 (Orioles and Dodgers), '86 (Royals and Cardinals) and '94 (Blue Jays and Phillies).
0
Nine-inning outings for the Yankees' Gerrit Cole, the Reds' Trevor Bauer and the Phillies' Aaron Nola. Why is this significant? Because they are all either leading their league outright (Cole) or tied for the league lead (Bauer and Nola) in complete games, with two apiece!
Cole had a five-inning "complete game" in an Opening Night shortened by rain and another in a seven-inning doubleheader. Bauer and Nola had both of theirs in doubleheaders. Bauer and Nola are tied with the Cardinals' Adam Wainwright for the NL lead, but one of Wainwright's two complete games did come in a traditional nine-inning affair. Nobody in MLB has had more than one of those.
.920
The Padres' slugging percentage with the bases loaded. Not a big surprise if you saw the Friars hit a grand slam in a record four straight games in August, but still surprising from a historical perspective. This is the highest such slugging percentage of all time, surpassing the 2006 Indians' .737 mark (the year Travis Hafner tied Don Mattingly's single-season record with six grand slams).
Colorado's .769 slugging percentage with the sacks full also surpasses that record. Like so much else in this crazy season, these outputs are inflated by the smaller sample. But you have to admit that "Slam Diego" (the Padres have seven of the 42 grannies hit this year) does have a nice ring to it.
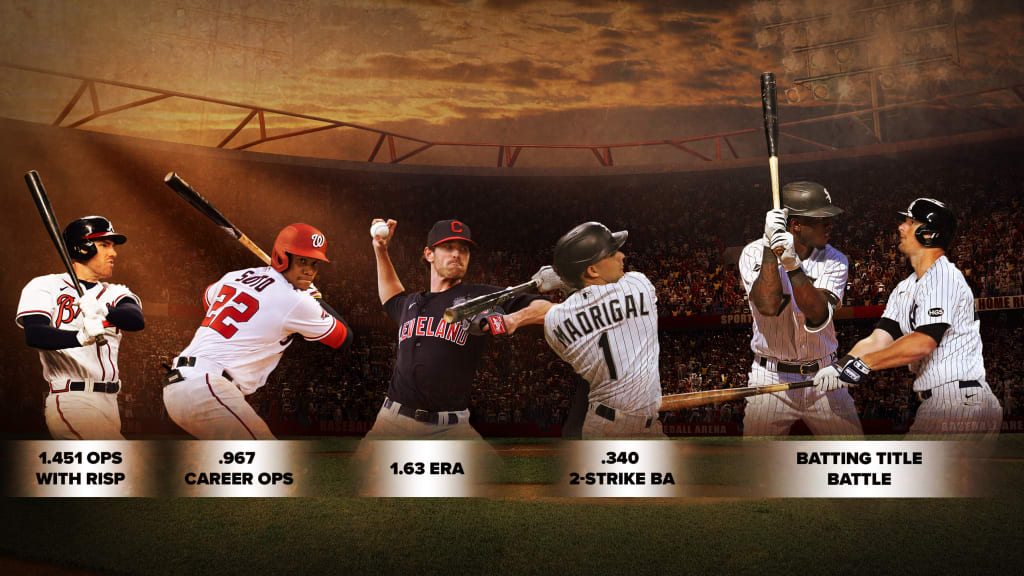
1.451
Freddie Freeman's OPS with runners in scoring position. This is how you insert and assert yourself in the National League MVP Award conversation. Only three other times in history has a qualified hitter had an OPS with RISP this high -- and it was Barry Bonds every time (1.698 in 2004, 1.594 in '01 and 1.551 in '02).
.967
Juan Soto's career OPS, through his age 21 season. There are other ways to illustrate the insanity of Soto's brief but bountiful output in a season shortened by COVID-19 for everybody and further shortened by COVID-19 for him (his 206 OPS+, for instance, would rank 38th all time). But it's still best to appreciate Soto from a more complete perspective. Among those with at least 1,000 plate appearances prior to their age-22 season, Soto's career OPS through his age-21 season ranks fourth, behind only Ted Williams (1.041), Jimmie Foxx (1.015) and Mel Ott (.986). Pretty good start to a career, wouldn't you say?
2.3
The ratio of strikeouts (86) to hits (37) for the Twins' Miguel Sanó, entering Thursday. Per the great Jayson Stark of The Athletic, this would mark just the third time in history that a league strikeout leader has twice as many K's as hits. Sanó joins the Tigers' Rob Deer (2.19 ratio in 1991), the D-backs' Mark Reynolds (2.13 in 2010) and the White Sox’s Adam Dunn (2.0 in 2012) in this interesting bit of infamy.
8
Number of qualified hitters who entered Thursday with a batting average below the so-called "Mendoza Line" of .200. This would be the most in modern baseball history. The season was abbreviated, the pitchers were ahead of the hitters after a quick Summer Camp and MLB, in general, has seen batting average fall precipitously in recent years.
Still, that you could fill out almost an entire lineup of guys with Bob Uecker-esque averages (Evan White, Joey Gallo, Bryan Reynolds, Kyle Schwarber, Max Muncy, Matt Olson, Carlos Santana and Javier Báez) is alarming. Even in the Deadball Era, the most sub-.200 averages any season produced was five (in 1904, '08, '09 and '17).
.340
Nick Madrigal's batting average with two strikes, entering Thursday. Prior to his August arrival, the White Sox No. 3 prospect had a reputation for basically never striking out, and he has lived up to it. He has more multihit games (10) than strikeouts (seven). And his batting average with two strikes would be tied for the fourth-best ever for a qualifier since at least 1988 (as far back as this data goes), trailing only Hall of Famer Tony Gwynn in 1994 (.397), Gwynn in '97 (.358) and Placido Polanco in 2007 (.350).
Meanwhile, the Giants' Austin Slater, who entered 2020 with a career .702 OPS (in any count), has a .929 OPS with two strikes that ranks 10th since 1988, behind the likes of Gwynn, Bonds, Frank Thomas and Albert Pujols. Austin Slater!
13-0
The White Sox record on days the opposition starts a left-handed pitcher. Has a team ever gone undefeated against pitchers of either hand? If you answered "no," we've got to hand it to you. Per the Elias Sports Bureau, the previous best winning percentage against pitchers of either hand came when the 1895 Brooklyn Bridegrooms went 8-1 against lefties. In the modern era, the best record was the 1941 Reds' 12-2 mark against lefties.
The Sox will face the Cubs' Jon Lester on Saturday with this bit of trivia on the line. However that game turns out, these have been some southpaw-smothering South Siders in 2020. Their .896 OPS vs. lefties, as of this writing, would be the best in history, topping the .885 mark of the 1998 Rangers.
2
Consecutive years in which the Yankees' DJ LeMahieu and the White Sox Tim Anderson will finish first and second (in some order) in the race for the American League batting title. When's the last time the same two hitters finished in the top two in consecutive seasons? That would be 1956-57, with two dudes named Mickey Mantle and Ted Williams. If the 2020 order is the same as in '19 (Anderson first, LeMahieu second), it will be the first time that happened in consecutive years since 1914-15 with Ty Cobb and Eddie Collins.
Hat tip to YES Network's James Smyth for digging up this gem.
0
Sacrifice bunts for the Reds, Brewers, Yankees and Rays, entering Thursday. They would become the first teams to go an entire season without one. It's a play that has been dying for decades, and that trend was accelerated by the addition of the designated hitter in the NL this year.
The Angels and White Sox, meanwhile, are on the doorstep of becoming the first teams since the 1984 Mets and Giants to finish a season with zero bunt hits.
.211
The Reds’ batting average. That would tie the 1906 White Sox for lowest team average in the modern era (the Rangers, at .213, are not far off). And to think, the Reds might nevertheless reach the playoffs. Are they the new “Hitless Wonders”?
Don’t worry, though, the all-time low recorded batting average -- the .175 mark posted in 18 games by the 1884 Wilmington Quicksteps -- appears to be safe.
1.63
Shane Bieber's ERA. Since the mound was lowered to its current height in 1969, only two qualified starters have fared better -- the Mets' Dwight Gooden in 1985 (1.53) and the Braves' Greg Maddux in '94 (1.56). Of course, those two both did it in more than 200 innings apiece, whereas Bieber threw 77 1/3 innings in his 12 starts. But Bieber made it easy on the AL Cy Young Award voters this year.
7.02
The Phillies' "relief" ERA, entering Thursday. It would be the second-worst all time, trailing only the ghastly 8.15 mark of the 1930 Phillies (coincidentally enough). But wait! The Rockies entered Thursday with a 6.98 mark. Which 'pen will prove the best at being the worst?
Meanwhile, the Mariners bullpen's 54.3 inherited runners scoring percentage is the highest on record (going back to 1974) and the Pirates' 37.5% save conversation rate is the worst since '56. What a year.
205
Number of players who have made their debut this year. To put that in perspective, there were 261 debuts in the 162-game 2019 season. Expanded rosters, injuries and doubleheaders all contributed to an especially rapid rate of promotions in the shortened year.
61
Players used by the Miami Marlins. That's just six shy of the all-time record set by last year's Mariners. And in case this bears repeating, the Marlins, who were besieged by a COVID-19 outbreak that required 130 roster moves just in the first six weeks of the season, did this in fewer than 60 games played! They are perhaps the best representative of what an unusual year it was.