

On the first Sunday of the 2023 season, Dodgers catcher Will Smith found himself in an impossible situation. At first base stood D-backs outfielder Corbin Carroll, baseball’s reigning fastest man. On the mound stood veteran righty Noah Syndergaard, notorious for his inability to hold runners on base.
On the first pitch to Geraldo Perdomo, Carroll took off, swiping second. On the second pitch, he stole third. Smith didn’t manage to get a throw off either time. Six days later, it happened again. In the third inning of the April 8 game vs. Arizona, Carroll once again attempted to run off of the Syndergaard/Smith combination. This time, at least, Smith got a throw off, and it wasn’t a bad one -- a 1.90 second pop time, better than the Major League average of 2.00, and it was well-placed, low at the bag.
It didn’t matter. Carroll was safe. He’s always safe. He’s a perfect 8-for-8 in steal attempts so far, and five of those have come off of the Dodgers, all with Smith behind the plate.
So Smith, currently sidelined as he works his way back from concussion symptoms, looks like he’s a pretty poor preventer of stolen bases, having cut down just one of the eight basestealers he's seen, an unimpressive 11% rate that's less than half of the 25% mark he had two seasons ago. (It's actually worse than that: He hasn't thrown out anyone, but instead got credit when Julio Urías picked off Mike Yastrzemski.)
Except … wait a minute. We know Syndergaard is extremely poor at holding runners on; he’s talked about this, openly, for years, and last year, 30 of 33 basestealers were successful against him. We know that Carroll isn’t just “very fast,” he is “literally the fastest.” Maybe it’s not so much that Smith didn’t do his job. Maybe it’s that the job he was given wasn’t possible to do.
Maybe, as 2013 NL stolen-base champion Eric Young Jr. once said, echoing the thoughts of a century’s worth of backstops, “You’re usually always stealing off the pitcher. Catchers … you know it doesn’t matter if he has a good arm. If you get a good jump off the pitcher, the catcher’s not going to be able to catch up.”
That’s wise advice, and so it’s time to take it to heart, and give credit where credit is due. Maybe it’s time to take into account the runner’s speed, and the lead that he gets, and the details around the pitch speed, movement, and location, plus knowing the handedness of the batter and pitcher, and realize that we have all of that information by the time the catcher even receives the ball. As we recently did with our Statcast catcher-blocking metric, we can turn all that into an expectation of success.
Maybe, it turns out, there’s just not a whole lot Smith could have done about this at all. As the latest Statcast metric, Caught Stealing Above Average, will tell you, he’s currently only a -1, or ever so lightly below average. That is: Smith hasn't actually thrown anyone out, but based on the chances he's been given, the expectation is that an average catcher would have thrown out just one.
***
Let’s examine that play from April 8, shall we? Looking at the standard broadcast video, it seems like 10,000 other stolen bases you’ve seen in your life
What we'll do is to freeze time when the ball gets through the back of the batter's box to the catcher, and think about all that can be known at that instant.
You know who the runner is (Carroll), and that he’s extremely fast. You know how far down the line he is -- in this case, 36 feet, leaving him another 54 feet to go. You know what side of the plate the batter hits from (lefty) and with what hand the pitcher throws from (right), and all the details of the pitch (an 88.6 mph changeup to the low, outside corner of the zone and 1.9 feet above the ground).
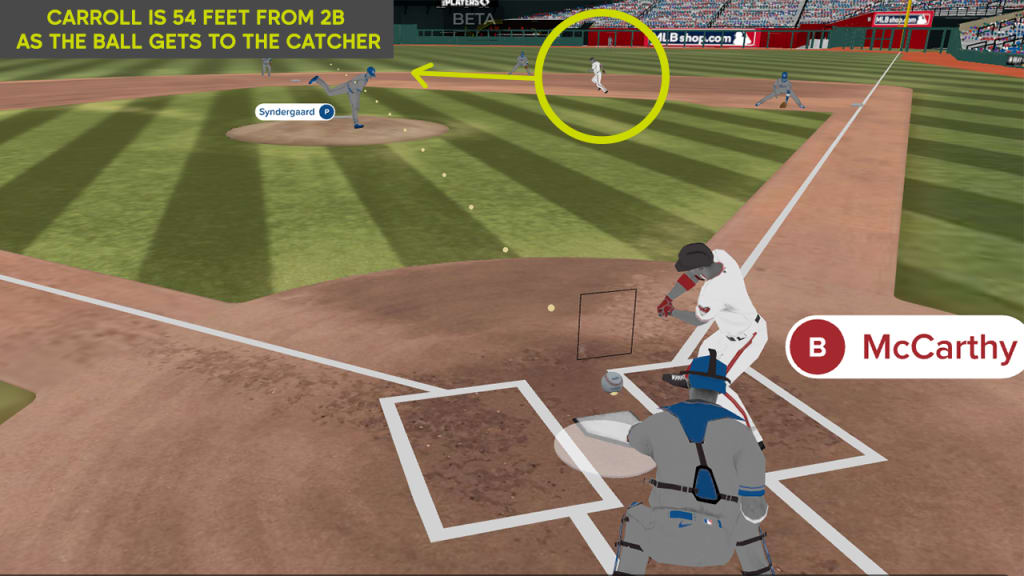
Based on all of that information, the model spits out that based on similar opportunities to this, the catcher is successful at throwing out the runner all of … 6% of the time. That’s it. When a runner that fast gets off to a lead that big, because the pitcher couldn’t hold him on any better, the catcher has almost no prayer of making the play. And so, Smith did not. But since it was deemed a play he could barely make anyway, then all he loses is -0.06, as opposed to the +0.94 he'd have gained if he were successful.
The point here is, as always: "Every opportunity is not created equally."
Since you’re definitely asking now, because 6% is not 0%, what does it actually require to throw out a runner off an opportunity that difficult? J.T. Realmuto showed us last summer, throwing out San Diego’s speedy outfielder José Azocar. All it took was an elite-level 1.77 second pop time and a throw that was so perfectly placed that Johan Camargo hardly had to even move his glove. It took, essentially, perfection.
If you can assign credit on each play, then you can sum those up into seasonal leaderboards. (For now, this is for attempts at second only; while third base will be added in time, it won’t change that much, as nearly 90% of steal attempts this year have come at second base.) Since it’s so early in 2023, let’s combine 2022-23 here.
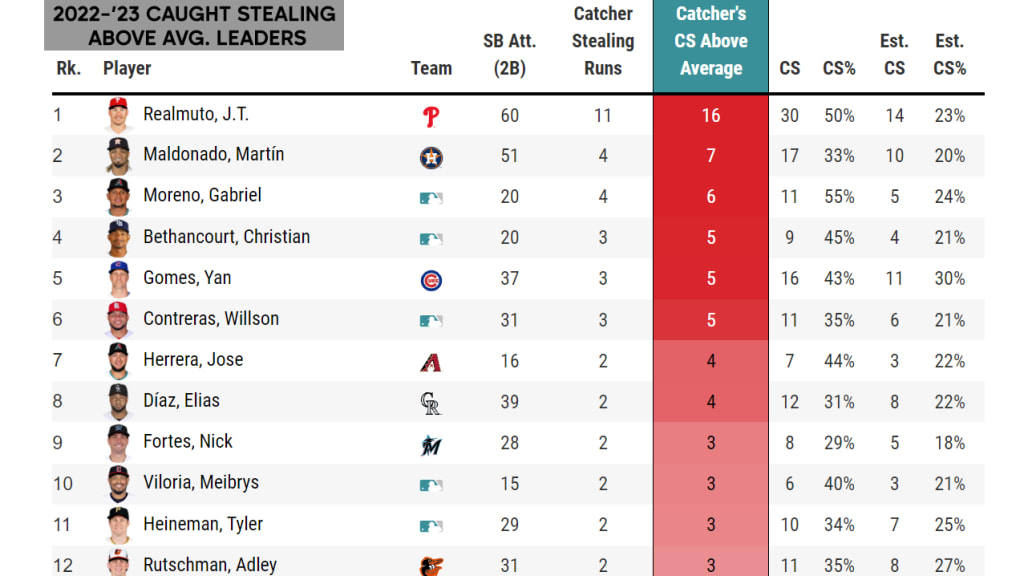
The first thing you should note is that Realmuto had an Aaron Judge-like season behind the dish last year, at least as far as throwing out runners at second goes. This data goes back to 2016, and in that time, Realmuto has the two best years, in 2019 and '22, and by a lot. He’s not just good at this; he is absolutely fantastic at it. (The second thing to notice: Arizona’s young Gabriel Moreno looks like he might be really, really good at this, too.)
Looking at it on a team level, you can gain some hints about what kind of opportunities catchers have been given. (A separate, pitcher-specific addition to the metric will come later this season.)
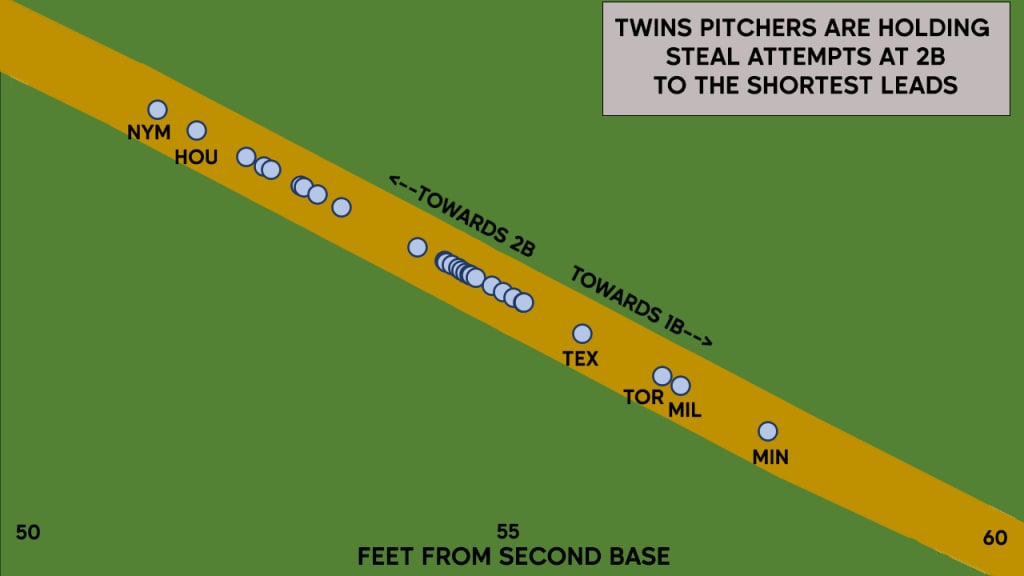
For example, is it bad that the Mets have thrown out only two of the 23 runners who have attempted to steal second base, an 8% caught-stealing rate? It absolutely is. But the team also rates 30th out of 30 teams with a mere 13% estimated caught-stealing rate, in large part because when runners have attempted to steal, they’re a mere 52 feet from second base when the ball crosses the plate, the smallest figure in baseball.
Mets catchers, at -2 caught stealing vs. average, have underperformed, but not by a whole lot. It’s hard when even the broadcasters are noting that pitchers are missing calls to step off.
So: Why are some of these good plays happening? The fun thing here is that you can assign credit for reasons, not just outcomes. Take this play from April 3, when Cardinals backstop Willson Contreras prevented Ronald Acuña Jr. from taking second base.
"A good jump," as the broadcast correctly notes, and the throw was strong -- 84.4 mph and a 1.82 mph pop time -- but the main reason that Contreras turned an 18% opportunity into an out was the accuracy of it. Tommy Edman barely needs to move his glove.
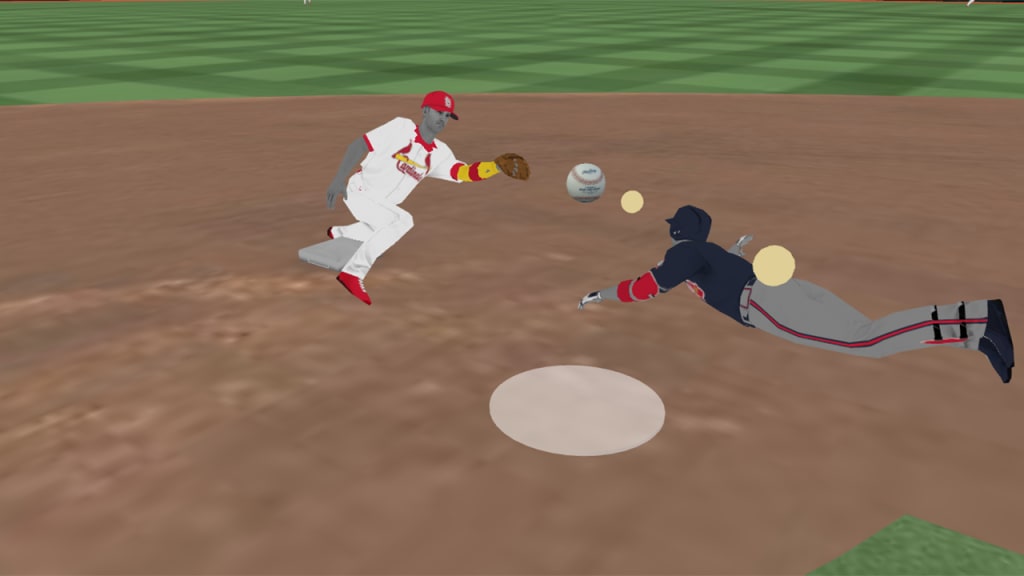
The 18% expectation means that since Contreras was successful, he gets +0.82 toward his seasonal total. But that +0.82 can be broken down, too, and in this case, it’s like this:
- +0.21 (throw speed)
- +0.14 (exchange)
- +0.47 (accuracy)
- +0.00 (teamwork)
The strength of the throw, and how quickly he got it off, both played a part. But the real star was the accuracy of it, which, as defined further by MLB.com’s Tom Tango here, really shows that the best place to put the throw is the area that’s roughly 1 to 3 feet above the ground, and 2 to 4 feet to the first-base side of the bag.
What’s that "teamwork" column, though? Consider it the "other" category, the credit that can’t really be assigned to a catcher, but has to go somewhere, like the fielder, runner or even the umpire.
For example: remember this famous Javier Báez tag, from back in 2019? Catcher Victor Caratini's throw wasn’t strong (a below-average 2.06 second pop time) and it certainly was not on target. Since Wil Myers, running from first, was thrown out, Caratini got a successful caught stealing. A perfect 1-for-1. He was hardly perfect:
Instead, look at the wild way in which this one breaks down.
- -0.01 (throw speed)
- -0.02 (exchange)
- -0.04 (accuracy)
- +0.90 (teamwork)
Ninety percent! On this play, at least, 90% of the caught-stealing credit here should be assigned to the fielder, Báez, who made “a stupendous no-look tag,” as the MLB.com story from that day said, and it was. If you’re wondering if this leads to a version of this leaderboard focused on the fielder side of all of this, it’s coming.
But today, what it means is that you can break down the skills. In 2022-23, for example, Realmuto is the best at preventing steals via his throwing speed (+7 caught stealing above average), and he's also the best at preventing steals due to his quick release (+7); just getting rid of the ball and down to second is the name of his game. Yet for all of that, he's below average at accuracy (-2), and he owes a little success to the other factors (+1). Conversely, the most accurate catcher in that time, Texas' Jonah Heim (+3) is below average overall, because he's quite slow to get rid of the ball in the first place (-4).
***
So what does all this mean?
If these numbers don’t seem huge, it's because they're not. Converting into runs, it’s a spread of about 10 from best to worst, setting aside Realmuto. That's somewhat similar to blocking, whereas framing is more like a spread of 30-40 runs from top to bottom. As Max Weinstein, then of FanGraphs and now of the Dodgers, wrote a decade ago, before Statcast even existed, “surface value says that a pitcher’s quickness to the plate is a whole lot more influential than a catcher’s arm in the battery dynamic.” These numbers may not exactly align with how Rockies coach Jerry Weinstein -- who literally wrote the book on catching -- broke it down, but they’re not all that far off, either.
That is, in part, because stolen bases just haven’t happened all that much over the past few decades, a situation which might slowly be turning back in the favor of the runners thanks to 2023’s new rules.
It’s true, too, that this metric doesn’t attempt to credit or demerit catchers for reputation, for singlehandedly preventing steal attempts just based on the fear of how good they are, though that’s a quite complicated conversation in itself. (As Russell Carlelton of Baseball Prospectus once aptly explained, it’s likely true that the legendary Yadier Molina caused baserunners to be more hesitant to go simply because they knew they’d have to beat him, but it’s also likely true this prevented runners Molina was more likely to throw out from taking off in the first place, thus costing him and his team those outs.)
Ultimately, though, we’re getting closer to what Billy Hamilton said back in 2015, echoing Young. “You steal off the pitcher, not off the catcher,” said the then-Reds speedster. “It doesn't matter who is catching."
It does matter, just not in the same way that raw caught-stealing percentage would have you believe. The next updates to this metric -- adding pitcher, runner and fielder -- will go a long way toward explaining that.
Still, we've come a long way since way back in 2016 -- very, very early in the life of Statcast -- we wrote about a particular Hamilton caught stealing, trying to figure out how baseball’s fastest man could have been thrown out by one of baseball’s weakest throwing catchers, Francisco Cervelli. At the time, we looked at the raw data and concluded that Cervelli had made a throw a little faster and a little more accurately than usual, but that was about the extent of the look we had seven years ago.
Now, with the data we have on hand, we know this: It was a mere 13% opportunity. Cervelli got no extra credit for a throw that wasn’t all that hard (+0.00), a ton of credit for the fast release (+0.50 exchange) and a nice boost for the accurate throw (+0.30). It was a great play. It was the second best of his career, at least the portion since 2016. We imagine he'd have enjoyed knowing that at the time.