
As he enters his eighth season in the big leagues, Brandon Belt continues to fly mostly under the radar. The first baseman and occasional outfielder isn't one of the bigger names in a revamped Giants lineup, but his production speaks loudly.
Despite a scary history of concussions -- he suffered his latest Aug. 4 and missed the rest of 2017 -- Belt has generated a 129 Weighted Runs Created-plus (wRC+) at the plate going back to his first full season in '12. That ranks 27th out of more than 200 players with at least 2,000 plate appearances during that time, giving Belt credit for his ability to get on base and slug in the power-suppressing environment of San Francisco. (He has nearly twice as many homers on the road in his career.)
There is one important way in which Belt truly stands above the crowd as a hitter, and it helps explain his success over the years.
A player ideally will lay off bad pitches and swing aggressively at good pitches. Doing one against big league pitching is tough enough, but doing both at the same time is a truly difficult task. This is where Belt excels.
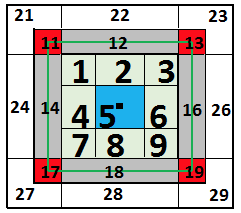
Before showing how he does so, it's necessary to establish what qualifies as "good" and "bad" pitches. This is where Baseball Savant's detailed strike zone helps, as it allows us to separate pitches far outside the zone from those along the edges and those comfortably within the zone. That first group (Nos. 21-29 on the chart linked above) represents the bad pitches, as Major League hitters produced a .115 average and .150 slugging percentage when swinging at them in 2017. The last group (Nos. 1-9) represents the good pitches, generating a .331 BA/.592 SLG on swings last year.
(We'll set aside the borderline pitches, which had a middling .249 BA/.386 SLG on swings, as going after them could be ill-advised or a necessity, depending on the count and situation.)
Therefore, one way to measure a hitter's selectivity is to calculate the difference between his swing rate on "good" pitches and his swing rate on "bad" pitches. It's rough, but it provides a reasonable idea of who is patient when required and aggressive when warranted.
Bringing things back to Belt, he has put himself in the top two in this metric every year since 2012, looking at players with a minimum of 200 pitches seen in both zones (a low bar that creates a sample of more than 350 hitters every season).
Leaders in "good" -- "bad" swing rate
Min. 200 pitches in both zones
2012: 1. Belt 69.2%, 2. Carlos Quentin 68.4 %, 3. Chipper Jones 67.2%
2013: 1. William Fowler 71.3%, 2. Belt 69.2%, 3. Freddie Freeman 67.9%
2014: 1. Belt 70.9%, 2. Miguel Montero 66.3%, 3. Freeman 65.9%
2015: 1. Belt 73.0%, 2. Nick Hundley 67.4%, 3. Melvin Upton Jr. 66.6%
2016: 1. Belt 70.6%, 2. Chris Iannetta 70.4%, 3. Montero 69.9%
2017: 1. Jabari Blash 75.0%, 2. Belt 73.7%, 3. Joey Votto 72.3%
To understand what a difference this type of selectivity makes, consider the 2017 case of Belt (119 wRC+) and Tigers shortstop Jose Iglesias (71 wRC+). Last season, they swung at the same number of pitches in total (853), but while Belt ranked second in good-vs.-bad swing rate, Iglesias' 28.6 percent mark was easily the lowest among the 370 qualified players.
Belt's swing rate on the bad pitches (9.7 percent) was more than three times lower than Iglesias', and his swing rate on the good pitches (83.4 percent) was more than 25 percentage points higher.
View the past six seasons as a whole, and Belt separates himself from the group of 225 hitters with at least 2,000 good and bad pitches seen.
Highest "good" -- "bad" swing rate, 2012-17
Min. 2,000 pitches in both zones
- Belt: 71.0%
- Iannetta: 65.6%
- George Springer: 65.2%
- Freeman: 65.1%
- Fowler: 63.8%
- Votto: 63.7%
- Jed Lowrie: 63.7%
---
223. Kevin Pillar: 35.2%
224. Martin Prado: 34.9%
225. Iglesias: 28.5%
Belt reaches these heights by doing well in both categories. During this period, he swung at about 14 percent of bad pitches, putting him among the 40 most discerning hitters in the sample. At the same time, when a pitcher challenges Belt, he is anything but passive. The left-hander uncorked his swing about 85 percent of the time on those "good" pitches, edging Freeman as the most aggressive.
Belt has made the most of those cuts, turning them into a .437 Weighted On-base Average (wOBA). That ranks 17th out of the 129 batters who ended at least 1,000 plate appearances on "good" pitches during that time.
Take the Giants' July 2 game at Pittsburgh. With his club holding a 3-2 lead with two outs in the top of the eighth, Belt came up with a runner aboard and worked a 3-1 count against Edgar Santana, taking both "bad" pitches he saw for balls. The first "good" pitch was a 3-1 slider over the heart of the plate, and Belt deposited it in the right-field seats at PNC Park, adding a pair of insurance runs in a 5-3 victory.
That's only one at-bat, but it speaks to the larger trend.
When it comes to picking his spots, Belt is as good as it gets.