

"The first inning is the highest-scoring inning" is one of those warmed-over old chestnuts of baseball wisdom that sounds like it can't actually be consistently true, just like "good pitching beats good hitting" and "small ball works better in the playoffs." Unlike those apocryphal half-truths, however, this one is true, almost all the time. The first inning is the highest-scoring inning. It's the highest scoring inning just about every single year.
Except, of course, when it's not.
For the first time since 2009, and for only the fifth time in the last five decades, the first inning (and its 5.12 runs per nine innings) isn't the highest-scoring inning in 2019. Instead, it's the third inning (5.19 runs per nine) where we're seeing the most offense -- for just the second time on record, after 2001.
This isn't unprecedented, but it feels that way. Just look at the previous 98 seasons, from 1921-2018:
• The first inning was the highest-scoring inning 85 times, or nearly 87%.
• Of the 13 seasons where it wasn't, six happened before World War II -- so since 1945, the first inning had been the highest-scoring 91% of the time.
This myth is confirmed ... but it's not happening this year. Why?
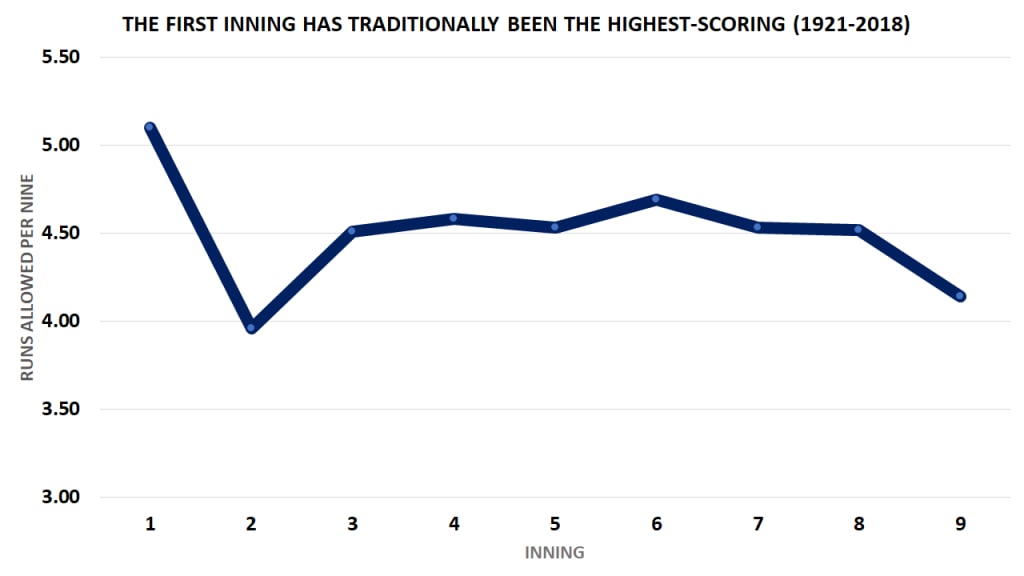
It's not hard to see what's long been happening here. The first inning is the only inning that the offense can guarantee that the top of its lineup, which should be comprised of its best hitters, will appear. Among the hitters in the top 10 for "most first-inning plate appearances" this year: Freddie Freeman, Bryce Harper, Mookie Betts and Manny Machado.
The second inning sees a large dip of more than a run, because you're more likely to get the weaker hitters at the bottom of the lineup. After that, things even out until you get to the ninth, where it's a little about "closers live here" and a lot about "the winning team with the theoretically better offense often doesn't even bother to bat."
The first inning was the highest-scoring every single year from 1962-97. It was the highest-scoring inning each of the last nine seasons, from 2010-18. It is, again, the highest-scoring frame more than 90% of the time, historically. In 2019: It's not.
So what's going on here? Is the first inning down, or is the third inning up? What about the other innings? Is this a fluke, or something more? The answer, as usual: Perhaps a little of everything.
* * *
1) The first inning is still as high-scoring as it ever was.
OK, so the first inning isn't the highest-scoring this year, a rare occurrence. That could either mean that first inning scoring is down, or another inning's scoring is up. (Or both.)
If we add this year's run scoring per inning to the graph we showed above, the answer to that becomes clear. What we're seeing in the first inning is pretty much what we always see in the first inning. Historically, the first has seen 5.10 runs per nine. This year, it's 5.12 runs per nine, making it the second-highest scoring inning this season. That's a small gap of 0.02 runs that isn't terribly meaningful; while there have been ups and downs over the years, the first inning was at 5.14 in 1977 and 5.15 in '44. What we're seeing today isn't unexpected or out of the norm.
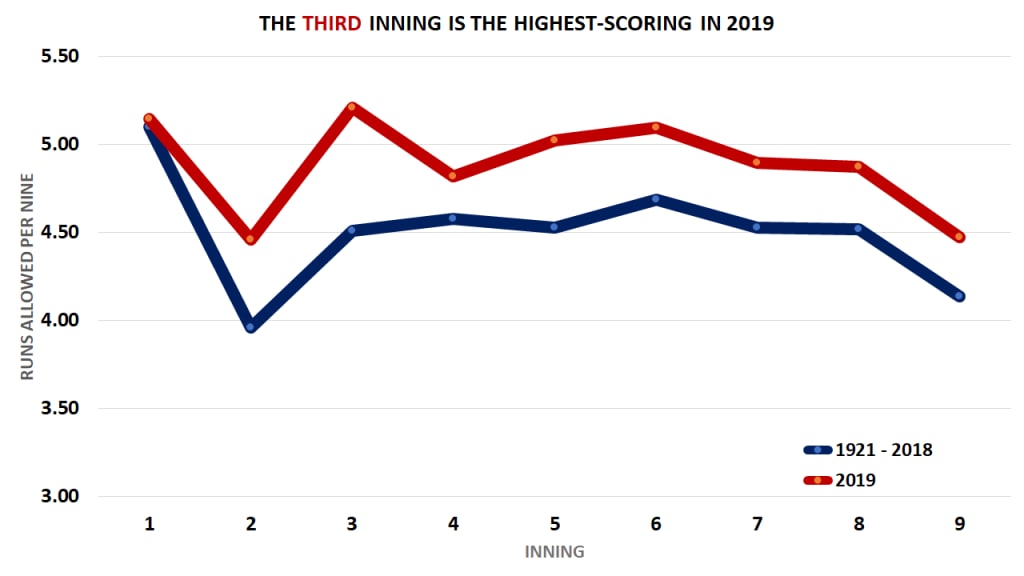
But that chart should show you something else, too. While run scoring isn't really up at all in the first inning, it's up by a decent amount in every single other inning. That's not surprising given this year's record-breaking barrage of home runs, of course, and you can see there's run-scoring added in every inning.
1st: +0.02 runs over historic average this season
2nd: +0.49 runs
3rd: +0.68 runs
4th: +0.24 runs
5th: +0.46 runs
6th: +0.40 runs
7th: +0.38 runs
8th: +0.32 runs
9th: +0.34 runs
In the first, however, there have been barely any more runs scored. If the third is an outlier in one direction, the first is an outlier of its own.
Why?
2) Wait, why isn't run-scoring up more in the first inning?
Looking at the other eight innings, you'd expect the first inning to be up at about 5.5 runs per game this year. It's not. You'd think about a few potential reasons here: Maybe the "opener" is really working well. Maybe bullpen games are better than mediocre fifth starters. Maybe starters are throwing harder right away if they need not pace themselves.
Maybe. But if hitters were truly performing worse in the first relative to other innings, you'd expect to see it in more than just runs scored. You'd expect it in something like OPS. You won't find it. This year, the first-inning OPS is .784, well above the historic average of .749. It's the 12th-highest ever. You're obviously running into some context issues there -- baseball is higher-scoring now in general than it was in, say, 1968 -- but that's also higher than last year or the year before or in any year since 2007. Batters, on the whole, are still doing well in the first.
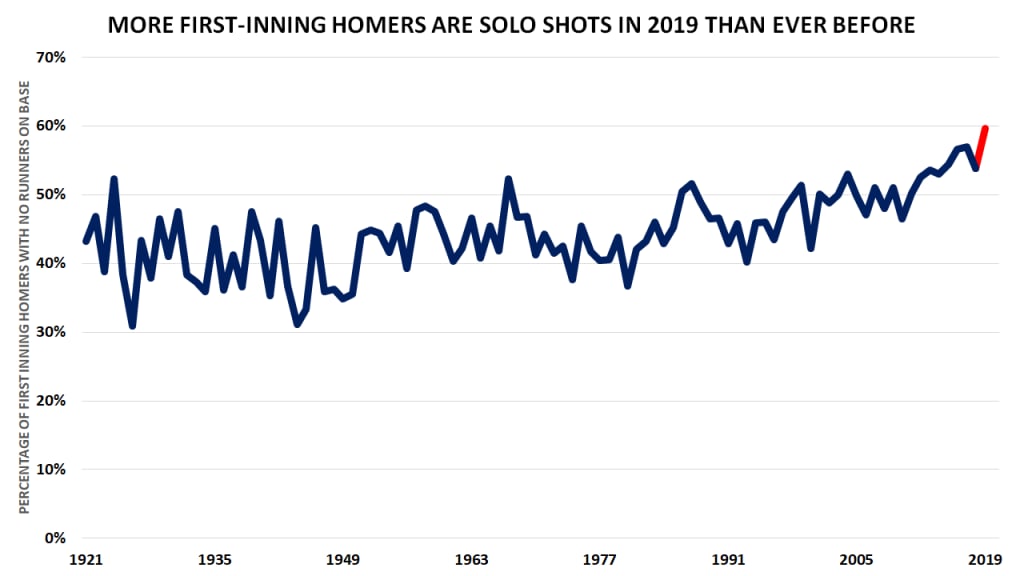
So where are the runs? Here's one theory: The rising tide of home runs has affected run scoring in the first inning less than any other inning, simply because there are fewer runners on base to drive in. This tracks because we have already smashed the all-time record for leadoff home runs with 732; by the end of the season, it might be more than 100 ahead of the previous record, 2017's 642. That's partially because the sport as a whole is homer-friendly now; it's also partially because power hitters like George Springer and Ronald Acuña Jr. hit leadoff, rather than the Billy Hamilton/Juan Pierre types of the recent past.
That's a lot of extra home runs, but it's a lot of extra solo home runs, at least comparatively. This year, nearly 60% of first-inning homers have come with no one on base. (In 2010, that number was just 47%.) It is, perhaps unsurprisingly, the highest rate of all time.
That might not be all of the first-inning story, but it's enough of the story. Still, it doesn't explain what's happening in the third inning. While scoring is up barely at all in the first, and a decent amount in the other innings, it's up by a lot in the third inning -- 0.68 runs over average.
Why?
3) The third inning is really high-scoring this year.
Again, the third inning being the highest-scoring has only ever happened once before. So this is weird.
The third inning isn't just the highest-scoring this year, it's the one most above its own historical average, currently sitting at 5.19 runs per nine, well above the average of 4.51. It's up by nearly a full run from just last year, when it was at 4.28 runs per nine.
That's an enormous jump. It's a little about home runs, as you'd expect, but it's not just about home runs. The third has seen 747 homers this year, fourth-most behind the first, fourth and sixth. Last year, the third had the seventh-most. The year before, it was the fourth-most. It actually has the lowest rate of solo homers this year of any inning, so there's that as well -- the influx of home runs is probably benefiting the third more than any other frame.
But this one is more about production, in a way that the first inning was not. Last year's third-inning OPS was .712, the 46th-highest in history. This year's third-inning OPS is .784, the second-highest in history. That might be in part about the fact that four-seam fastballs are the slowest in the third inning ...

... but it's the same in the fourth inning, and that hasn't seen as large of a jump.
There are, oddly, some individual teams with massive third-inning problems. The Twins have allowed a .670 OPS in the first inning and a .636 in the second, but an .836 in the third. The Cubs? .751 in the first, .603 in the second and .813 in the third. The Mariners? Well, it's a little different here; their .920 is bad, but it's not dissimilar to the .903 they allow in the second or the .900 they allow in the fourth.
It's difficult to pinpoint a cause, but a possible theory here is that it's the first inning, redux. That is: The first inning has always been the highest-scoring inning, because the best hitters get to bat. Now that teams do a better job of stacking the top of their lineups with their best hitters -- remember, Springer, Blackmon, Acuña Jr., et al, lead off, not the slap-hitting speedsters of days gone by -- they come up for a second time in the third inning. And when they do, there are more runners on base for their home runs, remembering that the third has the lowest rate of solo home runs of any inning.
After all, look at the hitters who have seen the most plate appearances in the third inning this year: Whit Merrifield, Betts, Acuña Jr., Blackmon and Francisco Lindor are on the list. If we take the Top 20 here -- including Pete Alonso, Freeman, Mike Trout, and Alex Bregman -- they have an .866 OPS this year, a mark 25 percent better than league average.
Now, compare this group to third-inning hitters from 10 years ago. In 2009, the most third-inning plate appearances went to speedy, less powerful types like Brian Roberts, Chone Figgins, Michael Bourn and Marco Scutaro. If we take that top 20, that group that year hit all of .255/.321/.393, a .715 OPS, and a mark 14 percent worse than league average.
(There's probably a small but difficult-to-quantify effect of the quality of relievers who are asked to pick up the pieces around this time of the game in disaster starts where the starter can't get past the first inning or two, but that's just speculation, and it's not necessarily new.)
It's also, as these things often tend to be, a one-year fluke. After all, the first inning doesn't get to be the highest-scoring inning more than 90% of the time by accident. It just hasn't quite received the same home run boost as every other frame, and the third inning is suddenly looking a lot more like ... the first inning. At least for this year, it's where the runs are.