

This week, there will be playoff baseball in Dodger Stadium and Petco Park, and also the Dodgers and Padres will face off in the National League Division Series. These are two entirely and completely unrelated statements. 2020 strikes again.
Thanks to the neutral-field bubble setup, the Dodgers and Padres will be nearly 1,500 miles from home in Texas, while their homes are occupied by the Astros and A's (Los Angeles) and Yankees and Rays (San Diego). The World Series will then be in Texas' Globe Life Field, and since the 22-38 Rangers are already well into their offseason, that means that there will not be another game for the rest of the season where the home team is at their home field.
Immediately, the wheels start turning. Instead of the Yankees and Rays holding Game 3 and (if necessary) 4 in the Bronx, with that enticing short porch, they'll be in spacious Petco Park. Instead of the the Braves and Marlins spending a game or two in the pitcher-friendly Marlins Park, they'll be taking aim at the Crawford Boxes in Houston.
That's going to matter. It might not always be so clear how, but you can absolutely guarantee that there's going to be a big spot where a ball dies at the warning track, and fans will guarantee that it would have definitely gone out at home, if only their team had been there. How do we approach trying to evaluate this kind of unexpected park factor?
Wait, it gets better. Three series -- the Braves/Marlins NLDS, the National League Championship Series, and the World Series -- and potentially 19 games, if everything goes as long as it can, will take place in a park that opened in July. That's right, Globe Life Field has hosted all of 30 games of baseball, and good luck assigning a realistic park factor to that. (Traditional park factors take years, not barely one-third of a normal home slate!) Anecdotally, it seems to play much larger than its predecessor, but it's difficult to tell since the Rangers' offense scored more runs per game at home while the Rangers' pitching staff allowed fewer runs per game at home. Either way, that's not how you do park factors, and even if it was: It was 30 games.
So instead of trying to do real, full park factors, which also try to adjust for strikeout and walk rate as well as what happens when the ball is in the air -- yes, parks can effect even non-batted balls -- we thought we'd do something different. Let's talk about homers, and which teams would have gained or lost them had they been been spending half the season in their new homes as opposed to their regular ones.
There's more to life than homers, of course, but teams that have out-homered their opponents in the playoffs have won 12 and lost 0 times this year. Teams that out-homer their opponents win about three-quarters of the time in the postseason every year -- in 2016, it was a hilarious 27-1 -- and there hasn't ever, once, been a postseason in which teams that outhomer their opponents haven't won more games than they've lost. Forget small ball; homers still matter.
So for each matchup, we'll show two things.
1) How many homers would have been lost -- or non-homers gained -- if each team had called this week's home their regular home.
We're not adjusting for approach, weather, elevation, etc. (Thankfully, the Rockies aren't here.) We're just showing what would have happened if we'd moved the trajectory of each batted ball to match the wall distances and fence heights of where these teams will be playing. For example, this Brett Gardner home run at Progressive Field in Game 1 of the Wild Card series would have been out of 16 parks, but not Yankee Stadium. In more than a dozen places, it would have hit the wall in places with deeper dimensions or higher fences.
We can show this for both hitters and pitchers ... looking at both home runs that would not have been, and non-homers -- which might be outs or non-homer hits -- that might have left the park.
2) The difference between each regular home field's pulled HR/barrel rate and this week's home.
A barrel is the perfect combination of exit velocity and launch angle, basically the best thing a hitter can do. (On barrels in 2020, Major League hitters had a .797 average and a 2.797 slugging. Over 81% of home runs came via barrel.) Since nearly two-thirds of homers are pulled, we'll use that, and show how often a pulled barrel turns into a homer, by venue, as a rudimentary park effect.
The Major League average here is 73%, which is to say that three-quarters of the time someone pulls a barrel, it's a homer. At the top is Cincinnati, with 84%, which makes sense; that's a well-regarded hitter's park. The hardest park to pull a barrel into a homer is ... well, you'll have to keep reading to see, but the number is a mere 57%. This matters.
OK? We're not predicting what will happen, so much -- park effects over a short series never seem to matter as much as we'd like them to. We're showing what did happen, and noting how that may effect what we see this week.
(Do note, for everything we're talking about below, the phrase "at home" should be construed to mean "in the home ballpark," not necessarily "as the home team," which is somehow not the same. Yet another item of 2020 weirdness we need to be specific on. We're also including the Wild Card games.)
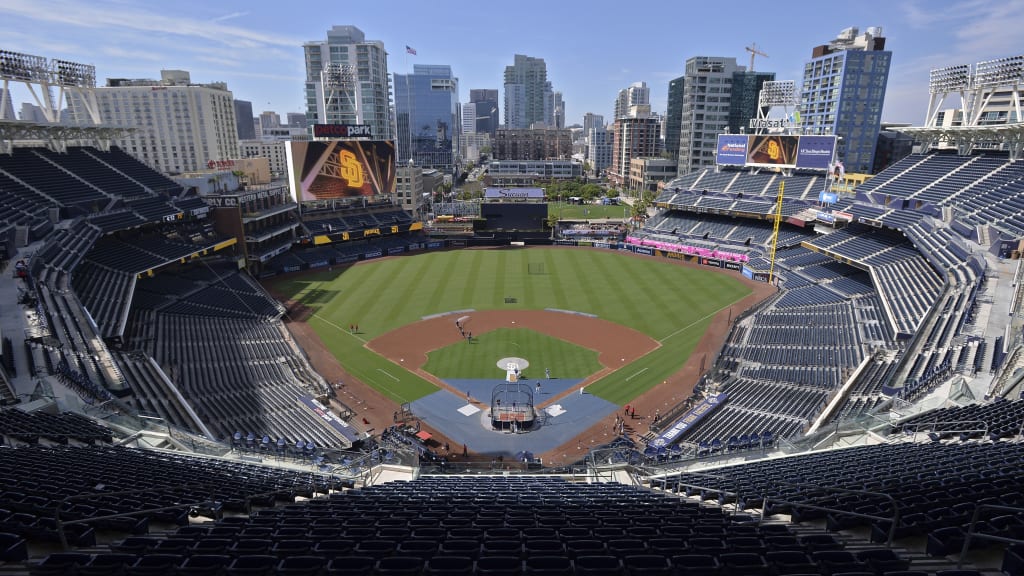
ALDS: 1 Rays vs. 5 Yankees (Petco Park)
Rays homers gained/lost: +7
Yankee homers gained/lost: -6 (gap of 13)
Tropicana Field pulled HR/barrel rate: 68%
Yankee Stadium pulled HR/barrel rate: 84%
Petco Park pulled HR/barrel rate: 80%
MLB avg. pulled HR/barrel rate: 73%
Petco Park isn't nearly the pitcher's paradise it once was, as that HR/barrel rate shows, and there's definitely something to be said for the difference between a hot summer day and a cool marine-layer evening. Still, you can see that the Rays and Yankees are coming from two very different parks, with the Trop being more difficult than average to turn a barrel into a homer and Yankee Stadium being the second-most favorable -- which all tracks.
That's borne out further by the fact that every single home run the Rays hit at home this year would also have been out of Petco, while seven of their non-homer batted balls would have been out, too. (On the pitching side, they'd have gained three and lost three, so no change there, and thus the overall +7 homers gained.)
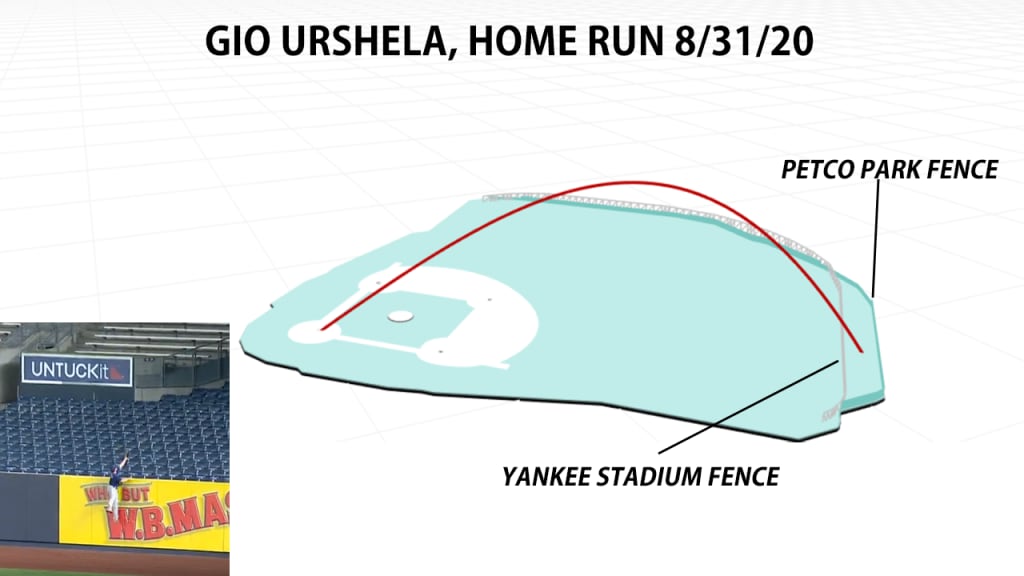
It's a very different story for the Yankees, who hit 12 homers in the Bronx that would not have been out at Petco. (You're already thinking about the short porch. You're not wrong, but this is not the biggest number we'll see. Keep reading.) You can see one of them by Gio Urshela here -- he hit it on Aug. 31 against the Rays, and it would have been out only at Yankee Stadium -- but this overlay image may tell the story better.
Four of those homers were by D.J. LeMahieu, who had hilarious home/road splits this year (1.317 OPS at home, .713 on the road), proving you can take the player out of Coors, but you can't take the Coors out of the player. Or something like that.
We figured you'd want to see them, so we reeled them up here, but once you've seen one, you've seen them all. That said, underestimate him, or call him a Yankee Stadium creation, at your own peril.
Now, half of that lost 12 is regained by the fact that Yankee batters also hit six balls that didn't go out in the Bronx that would have in San Diego. (Like, it should be noted, this one from LeMahieu.)
As for Yankee pitchers, it was an even six apiece -- six Bronx homers would have stayed in, (including two by the Rays), but six non-homers at home would have left.
Net result? Tampa Bay hitters are likely to enjoy life in Petco Park more than at the Trop. Yankee hitters may wish they were back in the Bronx.
ALDS: 2 A's vs. 6 Astros (Dodger Stadium)
A's homers gained/lost: -4
Astros homers gained/lost: +2 (gap of 6)
Oakland Coliseum pulled HR/barrel rate: 69%
Minute Maid Park pulled HR/barrel rate: 74%
Dodger Stadium pulled HR/barrel rate: 76%
MLB avg. pulled HR/barrel rate: 73%
You're a little surprised by this, aren't you? Not by the A's part, so much. Other than the far larger foul ground -- which isn't captured by the views we're choosing here -- the Coliseum isn't that different from Dodger Stadium. Oakland pitchers and hitters each had just a single homer at home that wouldn't have gone out in Los Angeles. Their bats also only hit one non-homer that would have gone out, while their pitchers allowed five. It's a difference, but not much of one.
But for the Astros, with the Crawford boxes, you expected more, didn't you? The reason their homers gained and lost number isn't larger is because it hurt their pitchers as much as it helped their bats. That is: Both sides did this a lot. The Houston batters hit 11 home-field homers that wouldn't have gone out in Los Angeles. The Houston pitchers allowed 12 right back.
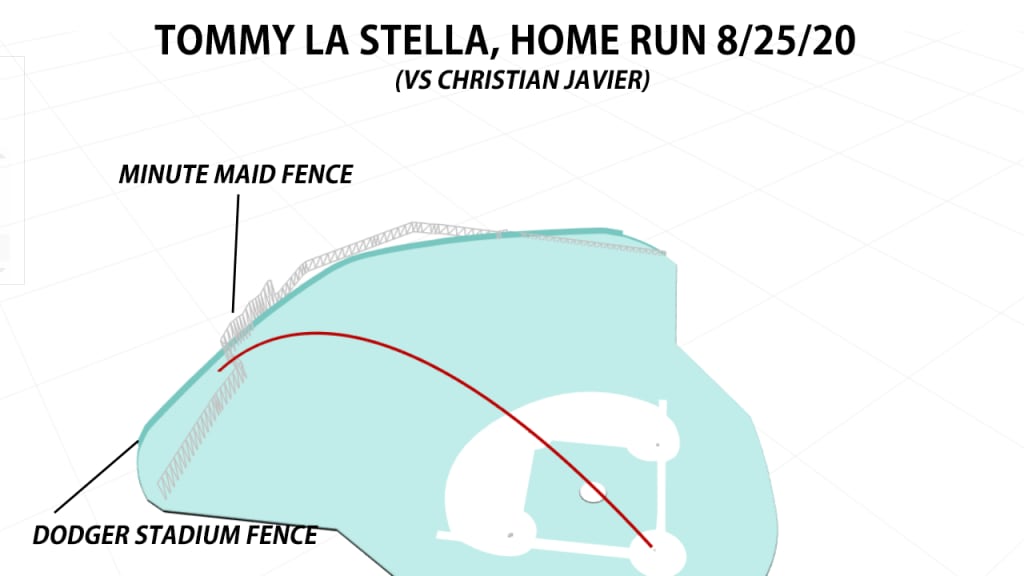
Christian Javier alone allowed four, and gaze upon just the Crawford-iest of Crawford Box home runs, allowed to Tommy La Stella on Aug. 25.
But you can see that work the other way too, like when Kyle Tucker mashed a double off the right-field wall in Oakland that would have been a homer in Houston.
Net result? This is going to be different baseball, but maybe not so advantageous for one side or the other, since it may not effect the A's outcomes much, while the Houston pitching gain (by balls staying in the yard) may be canceled out by a few cheap homers not given to their bats.
NLDS: 1 Dodgers vs. 4 Padres (Globe Life Field)
Dodgers homers gained/lost: -10
Padres homers gained/lost: +0 (gap of 10)
Dodger Stadium pulled HR/barrel rate: 76%
Petco Park pulled HR/barrel rate: 81%
Globe Life Field pulled HR/barrel rate: 77%
MLB avg. pulled HR/barrel rate: 73%
Here's our tricky one, because, again, there have only been 30 games in the new Globe Life. We might get half as many or more again in the playoffs here alone. It's not much to go on, other than anecdotes, small-sample data ... and the fact that the Dodgers hit 19 homers in Los Angeles that wouldn't have gone out here.
Wait, 19? That sounds like a massive amount, and it is -- partially because Dodger Stadium, especially to the power alleys, is more hitter-friendly than you think, and partially because the new Globe Life seems like it's going to be far, far less friendly to hitters than its predecessor was. (Back in May, before it even officially opened, Joey Gallo took BP and said that "it’s playing big. It is definitely going to be a pitchers’ park, I think.") It's 12 feet deeper to dead center than Dodger Stadium is, and more than 15 feet to the left and right of dead center.
It's also because looking at these, the Dodgers seemingly hit more 380-ft homers to the gaps than any other team. Here's one by A.J. Pollock that isn't out of more than two-thirds of parks, Globe Life included ...
... and one by Will Smith that would have gone out at just four parks.
Mookie Betts alone had five of them, including this one off of San Diego reliever Luis Perdomo.
Meanwhile, the Dodger pitchers had nine of their home-field homers that wouldn't have gone out in Texas, except there's a major caveat there: Five of them came from Ross Stripling, who was traded to the Blue Jays in July.
The Padres had similar issues, but it evened out perfectly; they would have had 12 home runs (hit and allowed) staying in the park in Texas, while having 12 other non-homer batted balls turning into dingers.
Net result? This Dodger lineup will hit in any park in the world, especially if injuries prevent San Diego from deploying something resembling their usual rotation. They still might have some homesickness, though, because they're likely to hit a few balls to the warning track in center and wonder -- correctly, probably -- how far into the stands that would have been in Los Angeles.
NLDS: 2 Braves vs. 6 Marlins (Minute Maid Park)
Braves homers gained/lost: +6
Marlins homers gained/lost: -1 (gap of 7)
Truist Park pulled HR/barrel rate: 68%
Marlins Park pulled HR/barrel rate: 57%
Minute Maid Park pulled HR/barrel rate: 74%
MLB avg. pulled HR/barrel rate: 73%
OK, now we're talking. Now those short porches in Houston are going to come in play, especially since Marlins Park is notoriously pitcher-friendly, and that hasn't changed this year. Remember before, when we said you had to keep reading to see which park had the lowest pulled-barrel-for-HR rate? It's Miami, at just 57%. The power-starved Marlins (only four teams hit fewer homers) may find themselves rounding the bases a little more here.
While the net home run changes aren't huge, the numbers that go into them are so big we'll have to break them out a little more.
Braves batters hit 22 (!) non-homer balls at home in Atlanta that would have been out in Houston (they gave back six dingers that Houston would have kept in). Dansby Swanson alone had five of them. See these five doubles? All out in Houston.
The Marlins had their share too, though 10 doesn't sound quite so impressive against 22. (They also hit three homers in Miami that would have not have been out of Minute Maid Park.)
On the pitching side, Atlanta hurlers allowed three long balls at home that wouldn't have gone out of Minute Maid. Two of them, however, were to Marlins hitters. Meanwhile, Braves hitters hit six homers at home that wouldn't have gone out of Minute Maid. Three of them were off Marlins!
Net result? Prepare for some softly lofted fly balls to left that wouldn't have gone out in either Atlanta or Miami ... and some absolutely blasted rockets from Marcell Ozuna or Ronald Acuña Jr. that might have been impressive in Atlanta, yet will look unprecedented in Houston, just because of how much closer everything is.
None of this will likely decide a series, of course. Each team is playing on literally the same field. We can be sure, however, there will be one moment, maybe a big one, when we'll think about what it would have looked like at "home." Maybe it will be the play that ends a game, or turns one; one that gives a pitcher new life, or ends his night early.
It'll come, however, that's for sure.
2020 wouldn't have it any other way.