

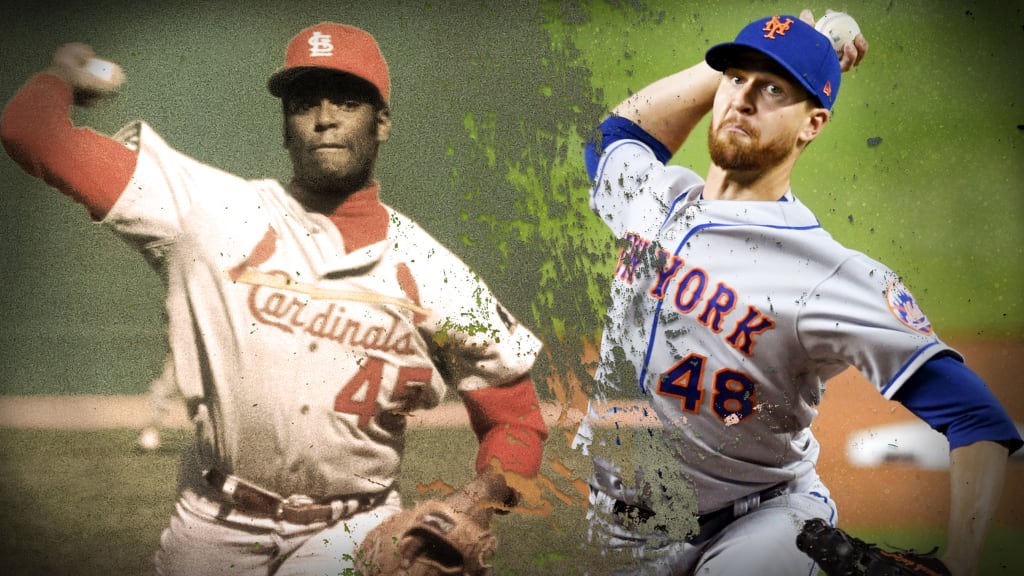
Most baseball fans would probably pick Bob Gibson’s summer of 1968 as the most dominant stretch of pitching the game has ever seen. In fact, Gibson’s dominance might have been one reason why Major League Baseball lowered the mound the following year.
Jacob deGrom fell just short of breaking Gibson’s record of 26 consecutive quality starts on Tuesday night, when his own 26-game streak ended against the Twins. But deGrom is still tied with Gibson, so is it time to ask: Has he been as dominant as the Cardinals legend?
The premise seems blasphemous. A quick glance shows that Gibson recorded a microscopic 0.90 ERA during his streak (Sept. 12, 1967-July 30, 1968), compared to a merely incredible 1.55 for deGrom (whose streak began last May 18). But a slightly deeper look shows that, by at least one measure, it’s a dead heat between the two.
FIP for Gibson and deGrom during 26-game quality start streaks
Gibson (1967-68): 1.77
deGrom (2018-19): 1.77
Source: FanGraphs
Fielding independent pitching, or FIP, is similar to ERA but only focuses on the events a pitcher can control: strikeouts, walks, hit-by-pitches and home runs. We should point out that deGrom owns a -0.28 FIP, per FanGraphs, to begin 2019 -- which doesn't mean he should have a negative ERA, but rather that FIP's formula expects that he shouldn't have allowed any runs thus far based on his strikeouts, walks and home runs over this very small sample size (and he hasn't). While FIP cannot definitively say which pitcher was “better,” it does highlight just how incredible deGrom has been on a per at-bat basis. The fact that deGrom can match up with peak Gibson in any regard speaks volumes.
(Note: Since FanGraphs' splits tool obly stretches back to 1974, we’re using FanGraphs’ FIP constant from 1968, the year in which the bulk of Gibson's starts came, to calculate his figure above)
Which ace owns the upper hand? The answer may come down to your statistical preference. Here’s each pitcher’s best argument.
Gibson: Unrivaled endurance
Gibson’s summer of 1968 evokes 19th-century baseball more than anything “modern.” He completed 19 of his 26 consecutive quality starts and was pinch-hit for in six of the seven games he didn’t finish -- meaning his manager actually removed him from the mound just once. Gibson peaked in June and July, when he allowed two runs in a span of 95 innings. One of those runs scored via a full-count double that landed on the foul line, and the other on a wild pitch.
"As I recall,” Cardinals outfielder Lou Brock said of his Hall of Fame teammate, “he didn't make one bad pitch over the plate that year.”
If you prefer a more old-school approach when appraising your aces, your pick is Gibson. He averaged nearly nine innings per outing during his streak, and deGrom has averaged a shade over seven. No other Cardinals pitcher touched the mound in Gibson's starts in the final half of his streak, during which he permitted just nine runs across 116 innings. As great as deGrom has been, he’s only completed one of 26 starts.
The sign above Gibson’s locker in 1968 read, “Here comes the judge.” That pretty much sums it up.
deGrom: Absolutely stifling
Gibson unquestionably owns the edge in workload and shutouts, but deGrom has racked up tons of the best outs a pitcher could ask for: The strikeout.
True, hitters are striking out more now than ever before, and especially more than in 1968 (22.3 percent of plate appearances in MLB were strikeouts in 2018, compared to 15.8 percent in ’68). But deGrom has fanned 33.8 percent of the hitters he's faced during his streak, more than two standard deviations above the mean for MLB starters. Gibson also ranked near the top of the class with a 20.6 percent strikeout rate, but that was “only” one standard deviation above the mean for starters in his day. The aces’ walk rates (4.8 percent for deGrom, 5 percent for Gibson) are nearly identical.
deGrom has allowed three more homers than Gibson during his streak, but teams are averaging nearly twice as many dingers per game now than in Gibson’s heyday. Gibson (.175/.222/.214) owns the slash-line edge over deGrom (.193/.235/.277), but the league’s .639 OPS in 1968 is its lowest mark in the last 100 years -- and 89 points lower than hitters’ collective OPS in 2018.
deGrom has also achieved most of his success under pressure, throwing 68 percent of his pitches during the streak while either the tying or go-ahead run was on base or at the plate. When adjusting for eras, deGrom's numbers begin to fall in line with Gibson's. He’s limited baserunners just as effectively.
The best stat to sum up deGrom’s dominance might be this: He’s allowed one or zero runs in roughly 58 percent of his starts since the beginning of 2018. And here’s the kicker: deGrom can keep this going. His fastball continues to be one of the game’s best, and now his changeup looks as good as ever, getting hitters to miss on exactly half their swings during his first two starts of the season. When deGrom is pitching, there are often moments that it seems impossible for anyone to get a hit.
Even if deGrom is not emulating Gibson by completing every game, he is starting to look just as impossible to opposing lineups.