
The game is changing, perhaps more quickly than ever. Forget comparing the sport to what it looked like in the 1960s or the '80s; the game has changed massively in just the last half-decade. Remember, just five years ago, we were all talking about the lack of power ,and no one was talking about launch angle or spin rate. Things are slightly different now.
That being the case, it's useful to look ahead and project the trends you'll see taking place on the field in 2019, so that you, the knowledable fan, will be one step ahead of the game.
One trend we won't be calling out: strikeouts. The number of whiffs have increased every year since 2008, and they'll probably go up again in '19. Pitchers are just entirely too good.
That aside, here are seven trends to keep an eye out for in the coming season:
You'll see more "openers"
On May 19, the Rays introduced "the opener" to modern baseball, and it proved to be a successful enough experiment for them -- though certainly having American League Cy Young Award winner Blake Snell around was a big part of their success as well. This is how Ryne Stanek made 29 "starts" while throwing only 66 1/3 innings, and how Ryan Yarbrough made only six starts, yet piled up 147 1/3 innings.
It's a little difficult to know how exactly many times the opener was used, because there are small-but-important differences between "the opener," "a bullpen game," and "a starter who gets knocked out early." But it's clear the idea spread fast, as the Athletics, Dodgers, Twins, Brewers and Rangers (at least) tried the idea out. Our best estimate is that it was truly used approximately 60 times, overwhelmingly from the Rays, along with eight September Liam Hendriks "starts" for Oakland.
In 2019, the Rays and A's have made it clear they're going to continue the practice. The Orioles, Marlins and Pirates are considering it. The Padres are "going to look at inventive ways" to overcome their lack of depth. The Giants may consider the opener as well, though clearly not in front of Madison Bumgarner or Jeff Samardzija.
San Francisco president of baseball operations Farhan Zaidi explained why the strategy is appealing earlier this month at Giants FanFest.
"I do think there are times where [using an opener] presents a real strategic advantage when you're looking at teams that have left-handed-hitting heavy tops of the order and you're planning to start a right-hander," Zaidi said. "Do you throw a lefty out there to go through that top of the order one time and make things easier for your starter? I can just say that when the opposition is thinking about using an opener, it makes your life harder. Our goal as a team should be to make life as difficult as possible for our opposition."
That's exactly right. It's too soon to know yet how many teams will use the opener, or how often they'll do it, but we'll put our money on "more than the approximately 60 times we saw in 2018," potentially a lot more.
You'll see more sliders, and fewer sinkers
Last year, 17 percent of all pitches were sinkers, or two-seam fastballs. Also last year, 17.1 percent of all pitches were sliders. Maybe that doesn't seem like a big difference, but since we saw nearly three-quarters of a million pitches thrown last year, it is. A tenth of a percent is approximately 720 pitches.
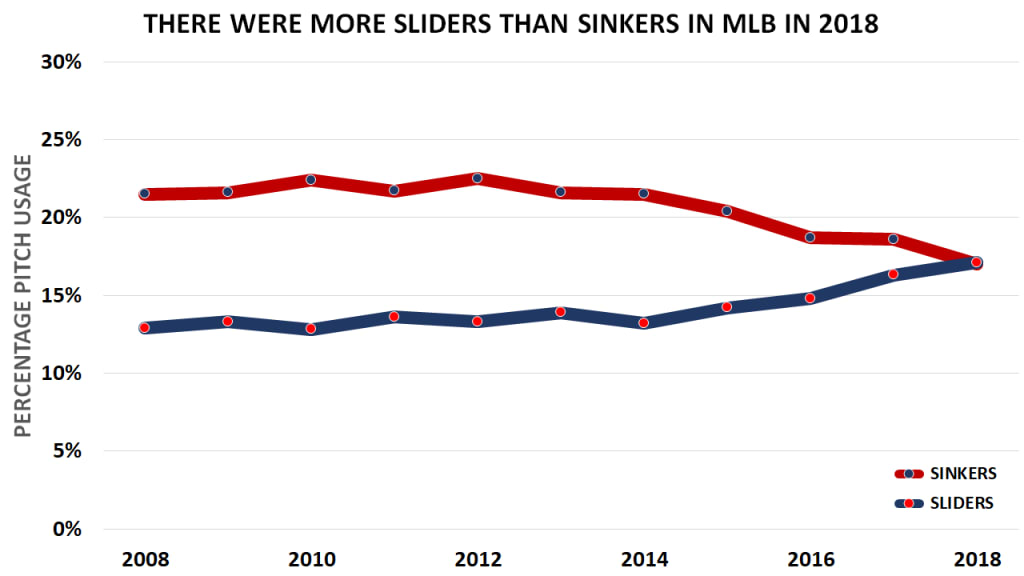
That's notable because it was the first time in pitch-tracking history, dating back to 2008, that pitchers in the Majors threw more sliders than they did sinkers. It's not hard to see why, not when you look at the outcomes of the different pitch types and where fastballs routinely get hit harder than breaking pitches. It used to be that pitchers had to "establish their fastball," but now, it's perfectly acceptable for, say, Patrick Corbin to throw his slider over 40 percent of the time or Romo to do so over 50 percent of the time.
"Take your best pitch and throw it a lot" shouldn't be revolutionary, but in some ways, it is. For most pitchers, the sinker isn't that pitch, especially if you're trying to miss bats.
Expect more wild pitches, and passed balls too
Baseball quietly set a record that you probably didn't even notice in 2018: We saw more wild pitches (1,847) than any season on record, going back to 1956. That broke the record set in 2017, which broke the record set in '16, which broke the record set in '15, and ... you get the idea. Throw in 370 passed balls, because there's functionally very little difference between the two other than "scorer's decision," and you get 2,217 pitches that weren't properly handled by catchers. That's 224 more than we saw when the 30-team era began in 1998.
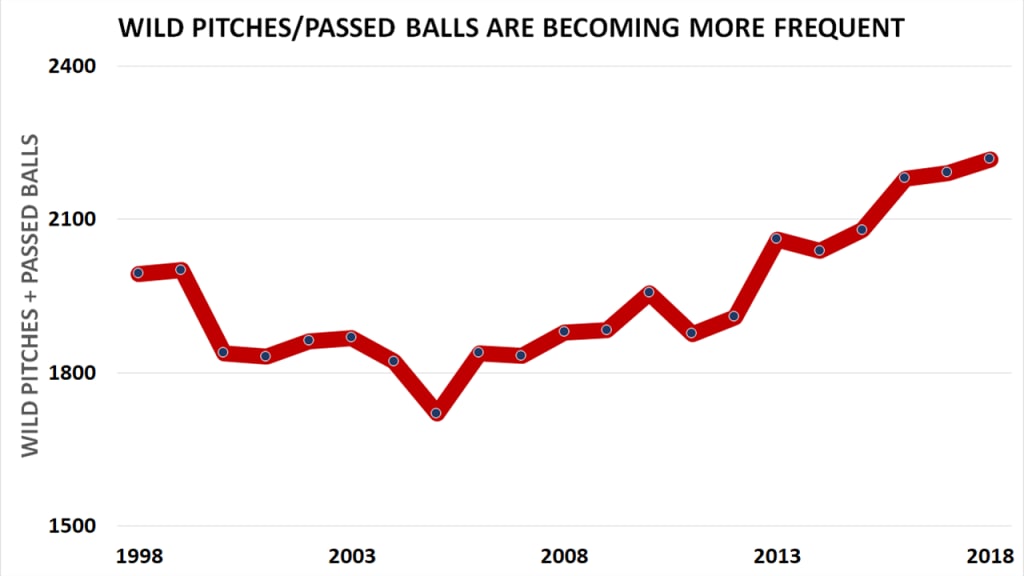
Let's be clear that this is not an indictment of the skills of catchers, who have probably the toughest job in team sports. This is about how much the responsibilities of the role have changed, in terms of velocity, emphasis on framing, increasing numbers of pitchers handled and so on. It's so hard to be a catcher. It's never been harder. This might be what the speed-focused Royals are counting on in 2019.
Fewer pitches in the strike zone
As we've explored here a few times in the past, just about the best thing you can do as a hitter is to swing at strikes and lay off pitches outside the zone. In 2018, for example, batters had a .284 average with a .485 slugging, or basically the line A.J. Pollock just put up. A full 92 percent of homers came on pitches in the zone.

Outside the zone, the results were slightly different, as you'd expect -- just a .155 average and a .213 slugging. We can't give you a player comp for that, because no hitter would last long with numbers like that. The point is, pitchers know this. They'd love for hitters to go after a breaking pitch outside the zone, and as we just showed, there are more sliders happening. Back in 2008, just over 50 percent of pitches were in the zone. In '18, that was down to 43 percent -- a drop of thousands of pitches.
A possible end to the increasing velocity trend
There's a number of different reasons why we keep seeing more strikeouts, as Adam Ottavino told us recently: "I think the pitchers are just super nasty now. And that's my diagnosis of why guys are striking out a lot."
He's absolutely correct, and a big part of that is the ongoing increase in velocity, which has been relatively consistently increasing for years. But, as Jeff Sullivan detailed at FanGraphs recently, it's possible we've finally reached "peak velocity." In 2008, just over 12 percent of fastballs were thrown at 95 mph or higher. By '15, that number was nearly 22 percent, a tremendous increase. The thing is, it hasn't gone higher. In '18, it was still just barely over 22 percent. The average fastball was 93.6 mph in '17... and 93.6 mph in '18.
It doesn't mean velocity won't go up again. It means that for the first time, we're seeing signs the trend may have slowed, or even stopped.
The game is still getting younger
We're tempted to say that this is entirely because Victor Martinez (age 40 last December) retired and Bartolo Colon (46 this May) hasn't yet found a job, but this is really more the continuation of a trend we've seen for some time. Here's what we said just over a year ago, looking into how different the aging in the game has become.
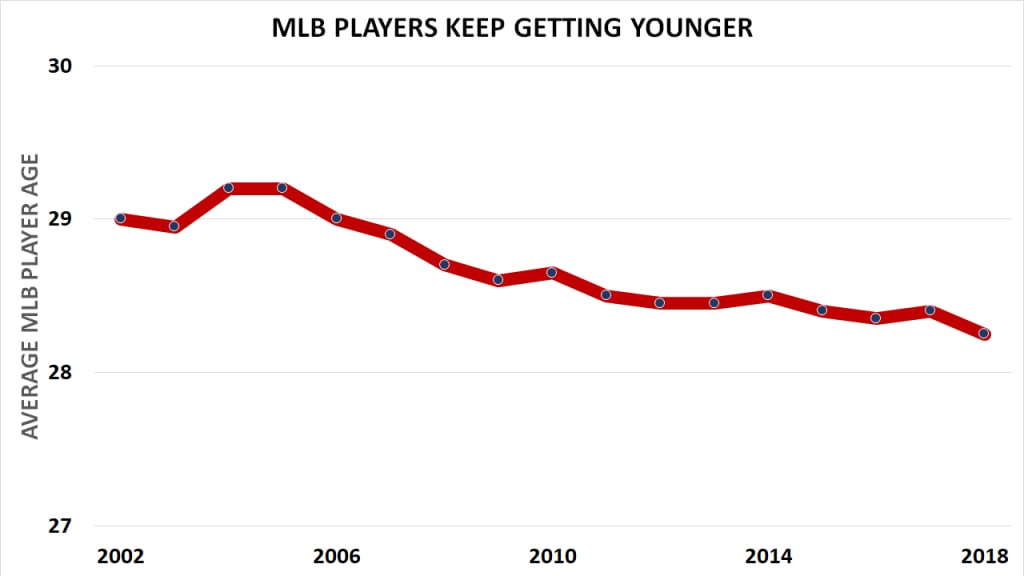
In 2000, players aged 30 and older took 86,019 plate appearances, and they threw 17,373 1/3 innings. They contributed 43.4 percent of all Wins Above Replacement (FanGraphs version).
In 2017, players aged 30 and older took 69,110 plate appearances, and they threw 15,241 innings. They contributed 32 percent of all Wins Above Replacement.
Now that we have 2018 in the rearview mirror, we can update those numbers, and it's more of the same.
In 2018, players aged 30 and older took 60,300 plate appearances, and they threw 15,129 2/3 innings. They contributed 29.8 percent of all Wins Above Replacement.
That's a drop of nearly 9,000 plate appearances to age 30-plus players in the span of a year, a truly enormous difference. That might mean that we couldn't possibly see such a large drop again in 2019, but the youthful trend has long been clear.
The continued devaluation of the "closer"
Remember this image from last year, when we talked about how the identity of a team's Opening Day closer doesn't really matter so much?

Well, what actually happened in 2018 was ... we tied the 30-team era record low of 11 closers with 30 saves for the second year in a row. Could we see '19 go even lower? Looking at the projected closer for each club, you can easily eyeball Boston, Tampa Bay, Kansas City, Minnesota, Chicago (White Sox), Seattle, Miami, Atlanta, Philadelphia, Milwaukee and maybe Cincinnati as places without clear closer candidates. (Plus, on the North Side of Chicago, Cubs closer Brandon Morrow will miss at least the first month.)
Obviously, Craig Kimbrel will land somewhere this spring, and you can expect him to get his 30 saves for the ninth straight season. On the other hand, this is probably part of what is playing into his slow free-agent market this winter; teams are less interested in strict three-out ninth-inning relievers than they used to be, favoring the flexibility of those like Ottavino or David Robertson.