

Among the many beautiful things about baseball that sets it apart from other sports, one of our favorites is just how different the physical ballfields are, and how much they impact the play of the sport within them. You know the specifics, surely. While football fields are always 100 yards long and 53 1/3 yards wide, in baseball, you can find the 37-foot-high Green Monster in Boston, or the 420-foot-deep center field in Detroit, or the short porch in right in the Bronx, or just the general everything about Coors Field.
Trying to express how players are affected by those differences is one of the core fundamentals of baseball metrics, and has been for many years. Any time you see a stat with a “+” on the end (like OPS+ or ERA+, for example) that means it’s been adjusted not only to set league average to "100" but also for park effects, among other things. The general idea here is a simple one: If you hit .280 at an extreme pitcher's park, you might really have done something as impressive as hitting .320 at a strong hitter's park, and you should get credit for that.
There have been several versions of park effect tables floating around various parts of the internet for some time, of course. Here, for example, is a study on how balls carry at different parks that Dr. Alan Nathan performed more than a decade ago. Here is a Baseball Prospectus article from 2001 (!) that deals with how parks may affect walk totals. This idea is not a new one.
What is new, however, is the park factor tool at Baseball Savant, which lets you explore Statcast-fueled park effects both in ways you might be familiar with and in new ways you probably aren’t. Here’s what you can do:
Want to see which parks are the best for hitters, or the worst? Here's how, dating back to 1999, in a variety of stats. You can, if you like, sort by batter hand, day/night, or (where applicable) roof open/closed. You can also look at single years rather than three-year rolling averages, but the three-year numbers are preferred to accumulate more data within. (That said, when you see only 28 parks appear with three-year rolling selected, that's because the Blue Jays and Rangers are playing in homes that haven't been open for at least three years.)
Same idea, but allows you to pick a metric and see it across all years and parks. For example, here's HR factor dating back to 1999.
Does your favorite park let the ball "carry" more than others? Maybe. In order to find out, we took all pulled batted balls hit at 90 mph or more, between 24-32 degrees of launch angle -- chosen both because this is the blast zone where carry really matters, and to make for an apples-to-apples comparison between parks -- to find any extra distance gained or lost above or below average. For example, in 2020, Coors added 19 feet. Oracle Park in San Francisco cost 7 feet. That all tracks.
For example, check out Arizona's Chase Field. Note what happened to home runs there after 2017 ... as they added a humidor for '18.
So: How does this all work? It’s not about teams. It’s about ballparks, and comparing the performance of players inside those parks as compared to what they do outside those parks.
That is: Miami, for example, was the toughest park to hit home runs from 2018-20. It’s not because the Marlins hit the fewest homers in that span. It’s because over those three years, there were 353 homers hit in Marlins games in Miami, and 491 homers hit in Marlins games away from Miami. It’s a little more complicated than that -- this accounts for the identity of the pitcher and batter, as you can read more about here -- but you get the idea. It’s about the venue more than the person.
Feel free to explore the new leaderboards, noting that everything is set to "100" for "average." Let’s dig up some of our favorite takeaways.
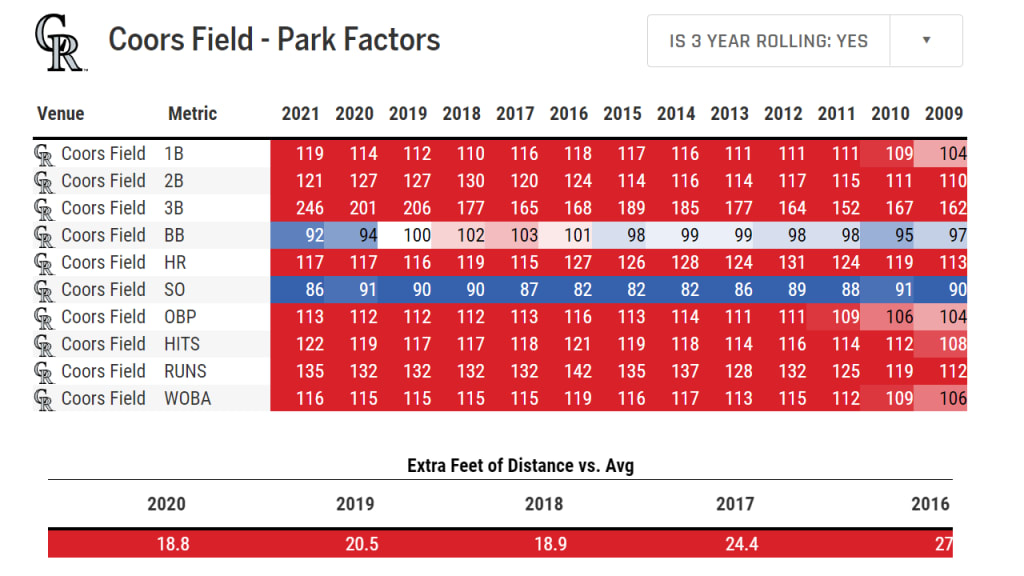
Coors Field is, obviously, the best hitting park.
This was the first thing we looked for. If Coors Field doesn’t pop up as the best hitting park, then your park factor does not work right. And so it is here, with the high-altitude stadium boosting offense by 15% over the three-year span of 2018-’20, more or less what it does every year.
This is what we see, mostly, across the board. Sticking to that same 2018-20 period, almost everything is up at Coors. Hits? You get 19% more there. Homers? 17% more. Triples? Well, that "201" there may look wild, but also it’s not an accident that there were 143 triples in home Rockies games over those three years and only 67 on the road, because the outfield is enormously large.
Seriously, just look at this place. Almost all of the metrics are in bright, bright red. All, that is, except for strikeouts and walks, because the breaking balls don't move as much and pitchers compensate with fastballs. In 2019, for example, there were 1,320 strikeouts in games at Coors, and 1,447 strikeouts in Rockies games away from Coors. It's like this pretty much every year.
... but Coors isn't the best home run park.
Is this surprising? We argue that it shouldn't be, given what we just said about the massive outfield in Denver. If you want a home run boost, then you want to go to Cincinnati's Great American Ball Park, which has been well above average in aiding home runs pretty much since the day it opened in 2003. Think about it this way: From 2003-2020, there were 3,713 homers hit in Reds games there. There were only 3,003 homers hit in Reds games elsewhere. That's a huge difference.
But why? It's not that the ball carries especially well there. It's not that the ball is hit any harder there; the rolling hard-hit rate for GABP is roughly average. It's mostly that it's a relatively small field; the total square footage of the outfield is the fourth smallest in the Majors, and one of the three smaller than it, Fenway, compensates with that giant wall. If you put the ball in the air here, you probably benefit.
That said, Cincinnati is a great home run park (35% above average from 2018-20) but it's merely a good hitter's park (3% above average in that same span). That's because it depresses non-home run hits, for a pair of obvious reasons. First, you've got the anti-Coors effect, where the cozy confines make it easier for outfielders to get to balls before they drop in. Second, some of those hits that might be doubles or triples elsewhere are homers here. Also, interestingly, this is a strikeout-boosting park (10% more than average). A bad batter's eye? Hitters too tempted by the bleachers? Maybe it's the steamboat.
Comerica Park is a better hitter's park than you think.
That's right, while the massive center field in Detroit absolutely swallows up blasts that would be a home run in most other places, there's a lot to like about Comerica if you're a hitter. For full disclosure, we've been talking about this one for years, including noting that Nick Castellanos regularly had a higher slugging percentage at home while he was a Tiger. Unsurprisingly, there's a ton of extra triples there, due to the space.
Just look at the difference in outfield space between Comerica and Wrigley Field, for example, where Comerica is much deeper to center, but actually shorter down the lines. But look, also, at the hard-hit leaderboards. Comerica routinely boosts the hard-hit rate. That shouldn't be surprising, really; in 2017, for example, we saw a .460 slugging percentage in Tigers games at home and a .425 mark on the road.
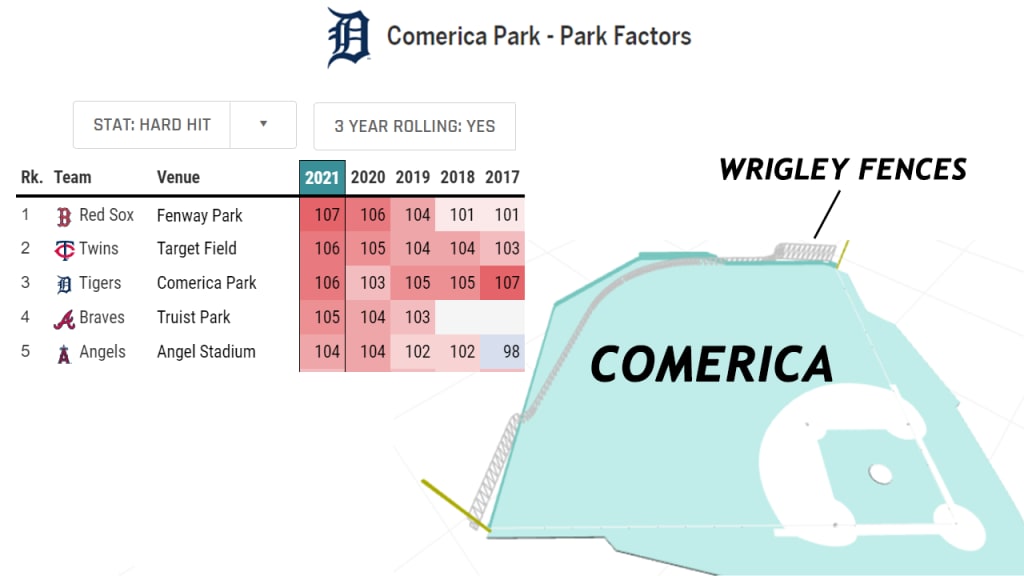
But why? As we suggested in 2018, it seems like the backdrop might just favor hitters. "I see the ball well there. It's got a good batter's eye," said Brandon Moss at the time.
The ball does carry in Dunedin, sort of.
This early in the season, you should be hesitant to put too much into single-season park factors of any sort; that's why the three-year rolling averages are always preferable, where available. Still, because of the unusual situation the Blue Jays find themselves in this year, and the reputation that TD Ballpark is already generating, we figured it'd be worth touching on here.
It is true that in terms of extra distance added in the fly ball ranges we mentioned above, the ball gets an extra 5.5 feet of carry in Dunedin over other parks. That's tied for seventh most, and it's nice at least to see that even this early on, Coors is still easily in the lead. Now, it's obviously warmer in Florida in April than it is in other places, and we don't expect the Jays to stay there all season anyway, so don't consider this a guarantee of what this number might look like in a few weeks or months.
But, as to the "sort of," don't confuse "the ball carries well here" with "that causes all the home runs." It's one thing to say this Bo Bichette wall-scraper might have carried out. It's another thing to say that the park had a whole lot to do with Aaron Judge (111.9 mph on April 14) or Vladimir Guerrero Jr. (111.3 mph on April 8), for example, blasting homers out of the yard.
Angel Stadium is a great home for Shohei Ohtani.
Many parks don't have a terribly large difference in outcomes for lefty and righty hitters. But then there's what's going on in Anaheim, specifically in terms of lefty batters hitting homers. Just look at the rolling home run factor, split by handedness, and you'll see that not much has changed for righties. It's been an average to slightly below-average dinger park for right-handed hitters for years. But for lefties ... well, look at that.
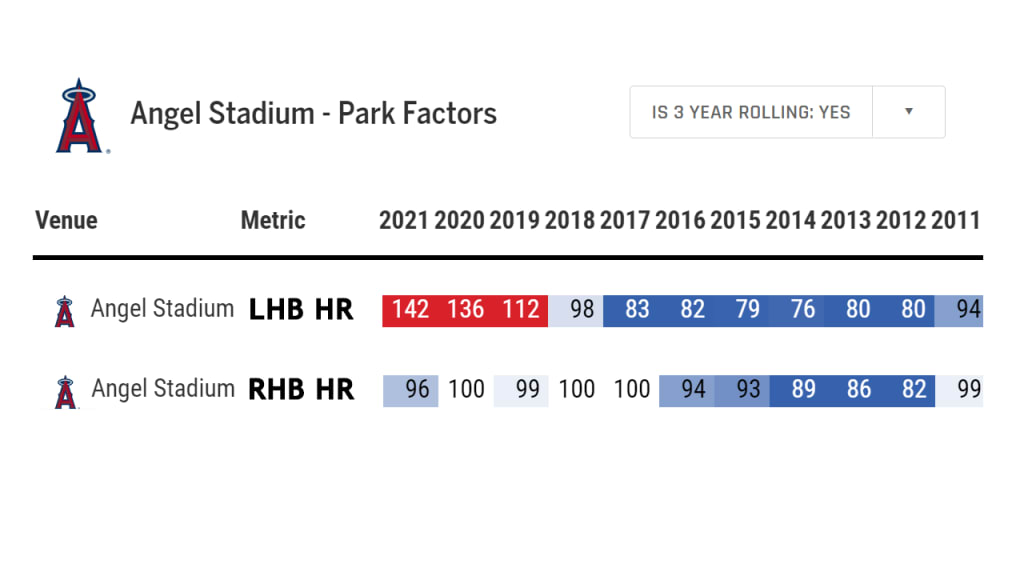
OK, so, why? It's not really specifically about Ohtani, though he does have 33 homers at home and 21 on the road so far in his career. This appears to be, to some extent -- though maybe not entirely -- due to a change the team made in right field prior to the 2018 season, lowering the height of the wall in right from 18 feet to 8 feet. When we went and looked at the data to see what might happen, we came away with an estimate: 8.5% more home runs, which is more or less what happened.
This is too simple of an answer, though, because righty batters had been affected by the wall as well, and as it turns out, the wall wasn't the only major change the Angels made in the offseason of 2017-18. They added a 5,488-square-foot video display in left field. They added a 9,500-square-foot video screen in right field. They added more than 23,000 square feet of screens overall that winter. It's speculation, a little, but it's not hard to think that's a big part of what is making the park play differently.
Strikeouts are a park factor, too.
Kansas City's Kauffman Stadium is absolutely enormous, in terms of outfield size. It's the largest outfield in the Majors, just ahead of Coors Field. That's why it allowed the fourth-highest batting average on balls in play from 2018-20 (so much ground to cover) and also saw the second-highest average distance on home runs in that time (because you really have to muscle one up to get it out of there). And so, if you were to look at their various factors over the years, you'll be unsurprised to see that it does much better than other parks at singles, doubles and triples, while also being one of the most difficult parks in which to homer.
Not much of that is surprising. But what does stand out here is that Kauffman suppresses strikeouts -- or increases contact, if you prefer -- considerably, too. It's regularly among the most difficult parks at which to strike out. Why? It's not, again, due to the types of players the Royals have acquired. It's because of the park itself.
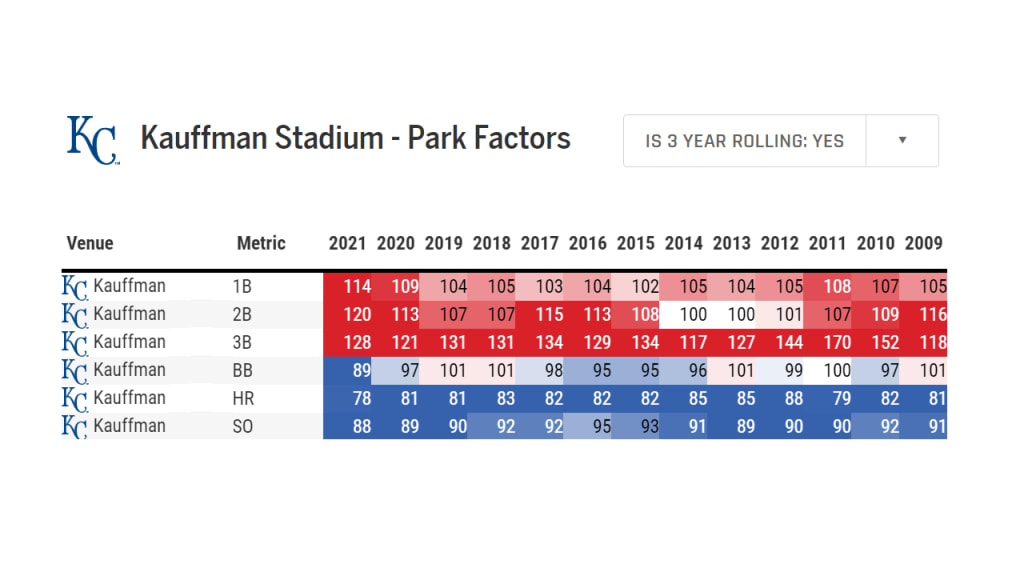
We touched on this earlier when it came to Cincinnati, but it's worth noting again that strikeouts and walks are also affected by parks, not just batted balls. So what's going on in Kansas City? It's always hard to quantify a batter's eye, and maybe it's that, to some extent, but maybe it's also a park effect created in a secondary way by the large dimensions. That is, if it's that hard to hit a ball out of, maybe you're better off not trying?
"It’s a big ballpark, so you can’t really swing for the fences all the time," Mike Moustakas told Ted Berg before the 2015 World Series, "and with that our strikeout numbers would be down because we’re making good contact all the time.”
Perhaps. Perhaps not. Park factors are, as always, complicated. There might not be one reason behind them. There rarely is.