

Edwin Díaz deserved better.
Yes, that 5.59 ERA in his first year in New York was sky-high. No, we can't make Mets fans forget some of those high-profile blow-ups. We're certainly not going to pretend that the Mets got the superstar ace reliever they thought they were getting when they surrendered a package headlined by Jarred Kelenic (currently the No. 11 prospect in baseball) to bring Díaz and Robinson Canó to New York. As far as introductions go, this was a poor one.
But a 5.59? No. That's the mark of a pitcher who barely belongs in the big leagues, and while we obviously can't hand-wave away the real issues Díaz had, things weren't quite that bad. We're here to make the case that what his performance was actually indicative of was a far more palatable 3.33 ERA.
How? Let's take a look at a new Statcast metric called Expected ERA, or xERA. If you've been following Statcast for a while, it's a simple conversion from Expected wOBA, putting it on an ERA scale, somewhat like FIP. If you're new to this, it's based on looking at the usual outcomes of the amount of contact he allowed and the quality of that contact (exit velocity and launch angle), and grading a pitcher based on that, attempting to separate out the effects of the ballpark, defense and luck.
(An individual play example of that would be if a pitcher gives up a crushed rocket that ought to be a home run 95% of the time, but he's saved by an excellent outfielder or a strong wind. We're more interested in knowing that he allowed a ball that overwhelmingly causes damage than that it fell for an out that particular time.)
In Díaz's case, the positive difference is because there was still a lot to like about his otherwise depressing season -- this wasn't the pitching version of Chris Davis suddenly being completely unable to make contact. After all, Díaz still struck out 39% of batters, a spectacular mark that was fifth-best among qualified relievers and the second-best mark from any qualified reliever in Mets history. While his 15 homers allowed were far too many, his .377 BABIP was the third-highest in baseball, while the underlying quality of contact he allowed suggested a .335 mark -- a gap which likely points to poor Mets defense or some poor fortune against him.
Like, say, this:
That elite strikeout rate, plus an average walk rate, plus a below-average rate of hard contact, comes out to a season that should have been .. roughly average. Hence, the 3.33 estimated mark -- and wouldn't you feel better about him, Mets fans, if that's what he had?
He wasn't fantastic, obviously, but the difference between that 5.59 actual ERA and that 3.33 expected ERA is massive. It's so big, in fact, that it's the largest gap (2.26) of any pitcher who faced 250 hitters last season. (Interestingly, in his fantastic 2018 season, his actual ERA [1.96] and xERA [1.91] were almost identical, suggesting it wasn't even good luck that got him to that point, it was all elite performance.)
Díaz aside, who else might have deserved better than they got in 2019? Let's take a look a few interesting cases.
Remember: This more describes "what did happen" rather than attempt to predict "what will happen," as it's not really built to be a predictive metric -- just look at Diaz's 1.91 xERA in 2018 that absolutely did not persist in 2019, remember. But if you're wondering about a particular pitcher's high ERA and wondering how much of it was "earned," this might help with that. (For example: Félix Hernández had a 6.40 ERA for Seattle ... and a 6.36 xERA. It wasn't bad luck. Sorry.)
Blake Snell
4.29 ERA, 3.02 xERA (gap of 1.27)
This is going to be a recurring theme, we think: "[Pitcher] was neither as good as they seemed in their best year, nor as bad as they seemed in their worst." When Snell won the 2018 AL Cy Young thanks in part to a spectacular 1.89 ERA, his xERA was a still-very-good-but-not-quite-as-sparkly 3.06. And when Snell had an injury-plagued 2019 that saw that his ERA more than double, his xERA was ... 3.02.
You think we're crazy for suggesting that a 1.89 ERA year and a 4.29 ERA year could be similar, and certainly he did throw 73 2/3 fewer innings in 2019 than he had in '18. And yet, compare some of the important underlying stats for Snell:
Strikeout rate: 32% in 2018, 33% in 2019
Walk rate: Identical 9% in both years
Hard-hit rate: Identical 32% in both years
Is there really a difference there? No. So what happened to cause his ERA to explode?
Partially, the effects of one bad start, when he allowed six earned runs in one-third of an inning at Yankee Stadium on June 19; that alone changed his ERA from 3.70 to 4.40. Partially, too, it was the defense behind him. In 2018, Rays defenders gave Snell a boost of 4 Outs Above Average on in-play balls hit while he was on the mound, while in 2019, they hurt him to the tune of minus-4 Outs Above Average, a swing of 8 outs.
Snell was never really a "true 1.89" pitcher in 2018, but he was better than 4.29 in '19. The answer, as usual: somewhere in the middle.
Noah Syndergaard
4.28 ERA, 3.41 xERA (gap of 0.87)
Unlike Díaz, Syndergaard won't get a chance to redeem himself this season since he'll have to undergo Tommy John surgery on his right elbow. The right-hander won't return until mid-2021, but let's evaluate Syndergaard's 2019 season.
Last year's Mets defense was seventh-weakest (-11 Outs Above Average), and the the 2019 Mets bullpen had the highest ERA in team history (4.99). That's a lot of non-support.
In Syndergaard's case, it's somewhat along the lines of Snell, because in a few important ways, he was exactly the same pitcher he was in 2018, when he'd posted a strong 3.03 ERA -- which had been backed up by a 2.95 xERA.
Strikeout rate: 24% in 2018, 25% in 2019
Walk rate: Identical 6% in both years
That's a good start. Now, where he did take a step back was in allowing hard-hit contact, which went from an elite 26% to a still-good 31% (an 87th percentile mark), and that contributed to his home run rate per nine jumping from 0.52 to 1.09 -- and that increase in loud contact is why his xERA did jump from 2.95 to 3.41.
So no, you can't pretend that he contributed nothing to that 4.28 ERA, because he did. But it does seem to be that there's a big perceptual difference between an ERA beginning with 3 and one with 4, and in this case, you -- and he -- would have liked the 3.41 mark better.
Josh James
4.70 ERA, 2.99 xERA (gap of 1.71)
For all the focus on the sign-stealing scandal this winter, the biggest issue for the Astros has always been their rotation depth, or lack thereof. Gone are the days of Charlie Morton, Dallas Keuchel and Collin McHugh; gone, to New York, is Gerrit Cole; Lance McCullers Jr. is only now working back from Tommy John surgery; and even Justin Verlander was dealing with a lat strain before the season went on hold.
It's true that they traded for Zack Greinke, so that's one spot, but it's always seemed like the flame-throwing James had the inside track on another -- though that 4.70 ERA was hardly encouraging. How are we getting him down to a 2.99 xERA? The starting place is easy: the strikeouts. Last year, James whiffed 100 in just 61 1/3 innings, a 38% K rate that was the seventh-best of any pitcher with 60 innings. (Nearly all of them came in relief, so we wouldn't expect that mark to maintain as a starter, but this is what he did last season.)
The problem, really, was the walks. James's 13.2% walk rate was eighth-highest, and while it's not entirely impossible to succeed that way -- Adam Ottavino and Matt Barnes were in similar ranges -- that's generally true more for relievers than starters. Like Snell, a large part of the damage to his ERA came in just a few outings, as 12 of his 32 earned runs, more than a third, came in just three games. Take those out, and in the other 46, his ERA was an even 3.00.
You can play that game for any pitcher, of course, and we're not done doing it. It's just a good example of how ERA can be iffy for relievers.
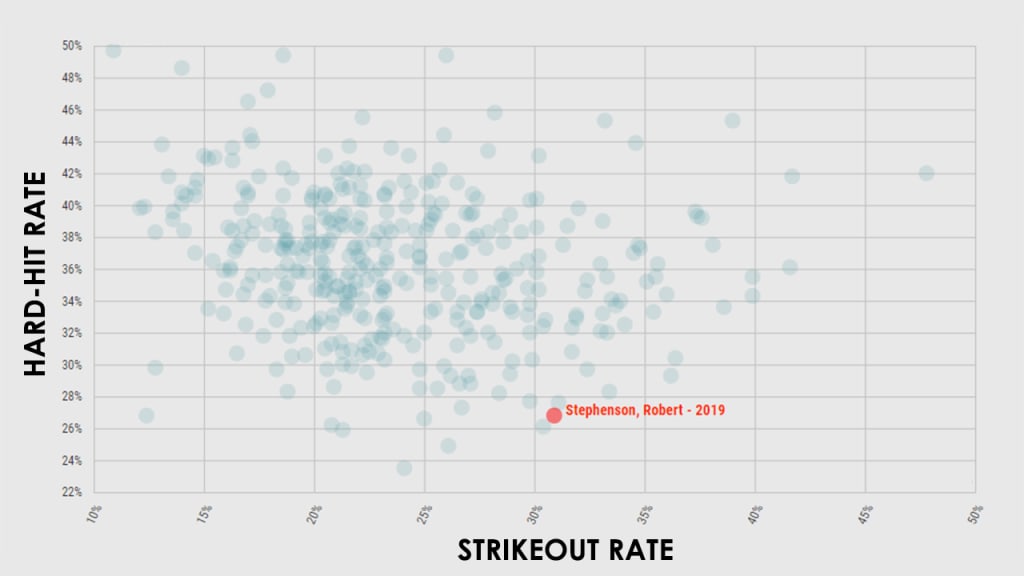
Robert Stephenson
3.76 ERA, 2.70 xERA (gap of 1.06)_
What's not to like about Stephenson? His 31% strikeout rate was well above-average, and his 27% hard-hit rate was elite -- it was in the 98th percentile. If you plot those two things together, you'll see that Stephenson occupied a somewhat rare high-whiff/low-damage area around Kenley Jansen and Adam Ottavino.
That's a really, really strong base to start from, and, as with many relievers, his season ERA was trashed by a single bad game -- when he allowed five earned in two-thirds of an inning to the Cardinals on July 18. Given that he only allowed 27 earned runs all season, those five were a big chunk of his season; take that day away, and we're looking at a 3.09 ERA.
If there's an issue here, it's the walks, as Stephenson's 9% rate was slightly higher than the Major League average. That's both an ongoing issue -- his 12% career rate is a lot higher than average -- and a slight improvement, as it was the lowest mark of his career. If he can keep missing that many bats and preventing hard contact, you'll live with it.
Bonus: Elieser Hernandez
5.03 ERA, 3.67 xERA (gap of 1.36)
You almost certainly have no idea who this is! But we figured that beyond the bigger names, it might be worth it to highly one of the lesser-known names, and Hernandez is clearly that. (He plays for the Marlins, who claimed him off waivers from the Astros following the 2017 season.)
To start with, he was dominant in 48 Triple-A innings, posting a 1.13 ERA with -- more importantly -- a very strong 69/14 strikeout/walk ratio. Then, in 82 1/3 innings for the Marlins, he posted league-average strikeouts (24%) and, despite entirely too many home runs allowed (20), he managed to post an 84th-percentile hard-hit rate, in part due to a slider that Eno Sarris of The Athletic termed one of the "weirdest pitches" of 2019. Taken together, that ugly 5.03 ERA might really have been a perfectly reasonable 3.67.
Now, about the other end, the pitchers who maybe didn't earn all of those low ERA marks last year?
You might wonder about Mike Soroka, who had a 2.68 ERA but a 4.05 xERA, as his soft-contact/few-strikeouts game is somewhat reminiscent of Kyle Freeland, who had a 2.85 ERA in 2018, but a 3.71 xERA. Dakota Hudson's 3.35 ERA isn't backed up by a 4.99 xERA, which makes sense, given his status as a groundballer who walked too many hitters and was supported by elite defense more than any other pitcher in the game.
They're still good, obviously, just not quite as good as the ERA one might have you believe. And that's sort of the point. ERA, in some ways, is a team metric. It tells you a lot about a pitcher, but certainty not everything.