

There are certain individual benchmarks that have become shorthand for successful seasons.
Even as the playing environment fluctuates over time, marks such as a .300 batting average, 30 homers and 100 RBIs continue to resonate when discussing hitters. The same is true of 20 wins, a sub-3.00 ERA or 200 strikeouts for pitchers. To be sure, those numbers did not mean quite the same thing in 2019 as they did in 1969, but they still carry some weight.
MLB’s 60-game schedule in 2020 changes everything.
Clearly, when it comes to counting stats (say, homers), the usual milestones will not be attainable in only 37% of the games. On the other hand, the smaller sample size means greater opportunity for gaudy rate stats (say, batting average).
Given all that, what sorts of numbers might league leaders produce this season? Simply prorating the usual numbers for a 60-game season is likely to be an underestimate. And it’s nearly certain that some players will overshoot their projections. At the same time, while we know that truly extreme results are far more possible over 60 games, it remains unlikely that someone will bat .400 or produce a 0.50 ERA.
To set some reasonable expectations, MLB.com looked back at the American and National League leaders in a handful of standard statistical categories -- through the 60-team-game mark -- over the past 10 seasons. Here is an analysis of those results.
For each category, we have noted the highest and lowest figures to lead the AL or NL through 60 games, during that period of time. For reference, the all-time-best 60-game stretch in that category is also included, as well as the full-season modern record (for rate stats), or prorated full-season record (for counting stats).
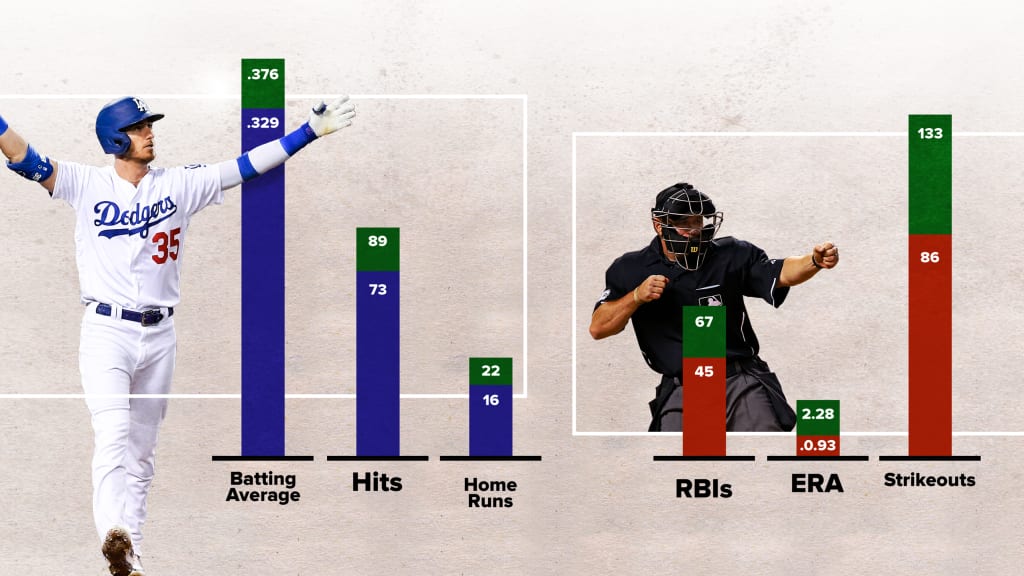
Batting average^
High: .376 (Cody Bellinger, 2019 NL; Robinson Canó, 2010 AL)
Low: .329 (Marlon Byrd, 2010 NL)
As one might expect for a stat that is subject to a great deal of fluctuation, there were a wide range of outcomes here over the past decade. In 2019, you had a superstar who started the season on a torrid hot streak (Bellinger) bat .376. Back in 2010, Byrd’s .329 was enough to lead the NL at the 60-game juncture. (To be fair, Andre Ethier was batting .364 but was one plate appearance short of qualifying). Other names both big (Mookie Betts, Miguel Cabrera) and not so big (Matt Joyce, Melky Cabrera) have put themselves on top as well. While a .400 average through 60 games has happened as recently as 2008 (Chipper Jones), it’s more likely that something in the .350 range will get the job done. Even that would be notable. No qualifier has hit .350 over a full season since Josh Hamilton in 2010.
All-time-best 60-game stretch: .466 (Rogers Hornsby, 1924)
Full-season record: .426 (Nap Lajoie, 1901)
^A minimum of 186 plate appearances (the standard 3.1 per game) was used as a qualifier.
Hits
High: 89 (Miguel Cabrera, 2013 AL; Robinson Canó, 2010 AL)
Low: 73 (Daniel Murphy & Matt Carpenter, 2014 NL)
Several hitters in recent years have approached the 90-hit mark through 60 games -- a brisk average of 1.5 per game. In addition to Cabrera and Canó, Xander Bogaerts (2016) and Dee Gordon (‘15) both got to 88 within the past decade. But nobody has actually cracked 90 since Ichiro Suzuki in 2001. In other words, that could be the magic number for the hits crown this year, although as recently as 2019, the AL leader (Jorge Polanco) clocked in with only 77 knocks through 60 games.
All-time-best 60-game stretch: 121 (Suzuki, 2004)
Prorated full-season record: 97 (Suzuki, 2004)
Home runs
High: 22 (Christian Yelich, 2019 NL; Josh Hamilton, 2012 AL)
Low: 16 (Corey Hart, 2010 NL)
As much as big flies have exploded in the past few seasons, not a whole lot has changed from the early part of the decade in terms of the league-leading pace through 60 games. Generally, 20 has proven to be a good target. That extrapolates to 54 over 162 games. A total of 20 would have been at least tied for the 60-game lead in 15 of the 20 league races since 2010, although one exception came in the NL last year, when Yelich went deep 22 times. There are certainly enough talented sluggers in the game right now to think someone could reach 25 this year, but nobody has actually done that in the first 60 games of a season since Albert Pujols in 2006.
All-time-best 60-game stretch: 37 (Barry Bonds, 2001)
Prorated full-season record: 27 (Bonds, 2001)
RBIs
High: 67 (Miguel Cabrera, 2013 AL)
Low: 45 (Mark Teixeira, 2015 AL; Three-way tie, 2010 NL)
Cabera’s 2013 season is the big outlier here. That season, when he didn’t repeat his ‘12 Triple Crown but did win a second straight AL MVP Award, saw him bat .368/.450/.649 with 17 homers and 67 RBIs while playing in each of Detroit’s first 60 games. But Cabrera is the only player in the past decade to crack 60 RBIs over such a stretch. Most of the leaders have clustered around 50, which would translate to 135 in a 162-game season. That makes sense, as no player since 2010 has reached 140 RBIs in total.
All-time-best 60-game stretch: 90 (Hack Wilson, 1930)
Prorated full-season record: 71 (Wilson, 1930)
Pitcher ERA^
High: 2.28 (Clayton Kershaw, 2017 NL)
Low: 0.93 (Ubaldo Jiménez, 2010 NL)
Similar to batting average, we’re all over the map here. In 2010, Jiménez kept his ERA below 1.00 through his first 12 starts, despite calling Coors Field home. And in the past four seasons, Hyun-Jin Ryu (2019 NL), Justin Verlander (‘18 AL) and Kershaw (‘16 NL) also have led their respective leagues through 60 games with ERAs below 1.50. At the same time, an ERA of 2.00 would have gotten the job done six other times in the past decade. Of course, a sub-2.00 finisher would not necessarily be a short-season phenomenon, given that in 2018, both league leaders (Jacob deGrom and Blake Snell) managed that feat. The real question is whether anyone can pull an Ubaldo and make a serious run at Bob Gibson’s hallowed live ball era-record 1.12 from 1968.
All-time-best 60-game stretch: 0.29 (Fernando Valenzuela, 1981; Lefty Grove, 1936)
Full-season record: 0.96 (Dutch Leonard, 1914)
^A minimum of 60 innings (the standard one per game) was used as a qualifier.
Pitcher strikeouts
High: 133 (Max Scherzer, 2018 NL)
Low: 86 (Ricky Romero, 2010 AL)
This is one case in which it would make sense to focus on the past few years, given the continuing rise in K’s. In the past decade, each of the six highest 60-game totals have occurred since 2017, including three from Scherzer, two from Gerrit Cole and one from Chris Sale. Scherzer’s incredible 133 in ‘18 (over 13 starts and 87 2/3 innings) is easily the highest, but all six of those totals were at 114 or above. In other words, don’t count on a number in line with Romero's for the 2010 Blue Jays being enough this year. Under normal circumstances, we might expect 115-120 K’s to be necessary for leading the league, but the fact that an abbreviated Summer Camp may leave pitchers less prepared for a normal innings load could drop that number a bit.
All-time-best 60-game stretch: 142 (Nolan Ryan, 1977)
Prorated full-season record: 142 (Ryan, 1973)