In Game 1 of the American League Championship Series on Sunday night at Petco Park in San Diego, the Rays coaxed five innings out of a shaky Blake Snell, then turned it over to their bullpen. Not the top of their bullpen, by the way; manager Kevin Cash was clearly trying to stay away from Nick Anderson and Pete Fairbanks, who had combined for 4 2/3 innings while finishing off the Yankees in Game 5 of the AL Division Series on Friday.
Instead, Cash went to four pitchers over the last four innings, who combined to keep Houston off the board and hang on to a 2-1 Game 1 victory.
That the Rays used several relievers and got success out of them isn't exactly news. After all, they did have the third-lowest bullpen ERA this year, and Cash has become well-respected for his skillful mixing and matching. But what stood out, especially if you were watching the game live, was just how different each of those pitchers looked.
Consider, including Snell, what these five pitchers had to offer.
• Snell: relatively traditional lefty, high release point, 95-mph fastball and three secondaries
• John Curtiss: high three-quarters righty, 94-mph fastball/slider, towards third-base side of mound
• Ryan Thompson: sidearming righty, 91-mph sinker/slider
• Aaron Loup: sidearming lefty, 87-mph sinker/cutter
• Diego Castillo: hard-throwing righty, 98-mph sinker/slider, far to first-base side of mound
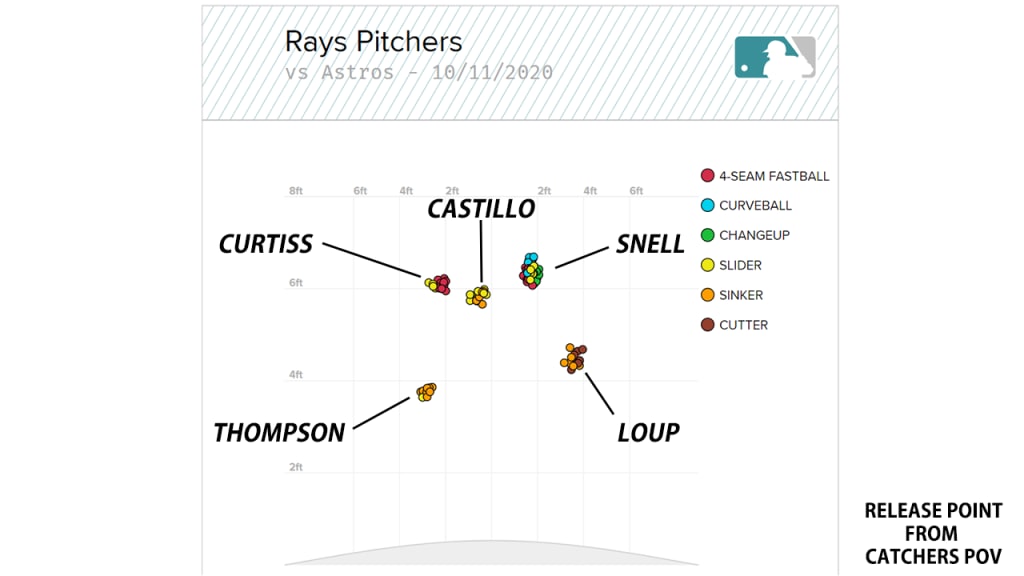
Maybe it'll be clearer on video. It's not easy to show five different release points all at once, but hopefully this gets the point across -- and remember, again, that these pitches are all coming out at different velocities and with different movements.
If you prefer to go to the data, it looked like this. Look at these incredibly distinct release points:

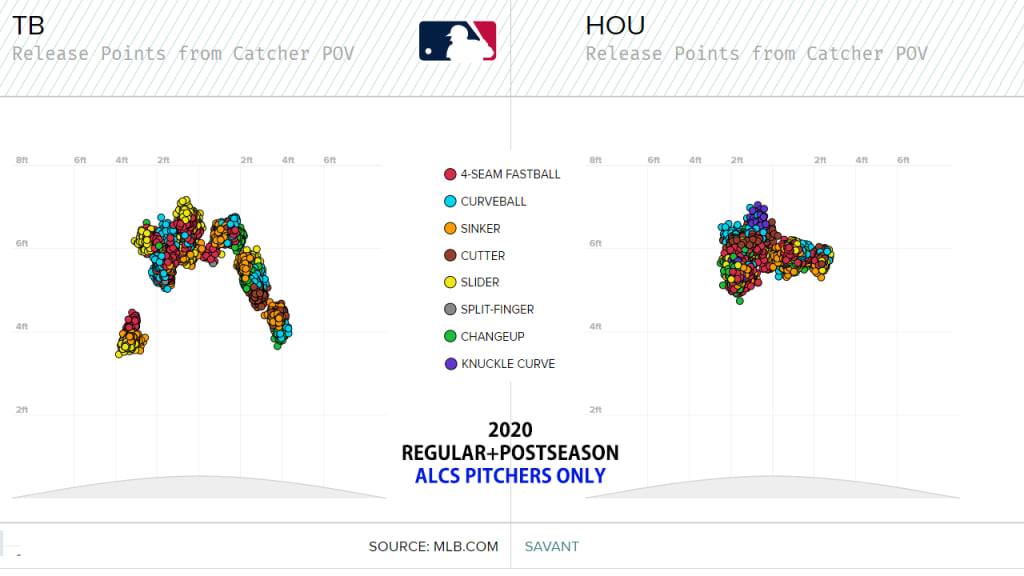
Compare that to the Astros in that game, who threw almost everything from the same spot, save for a few lower pitches from Enoli Paredes.
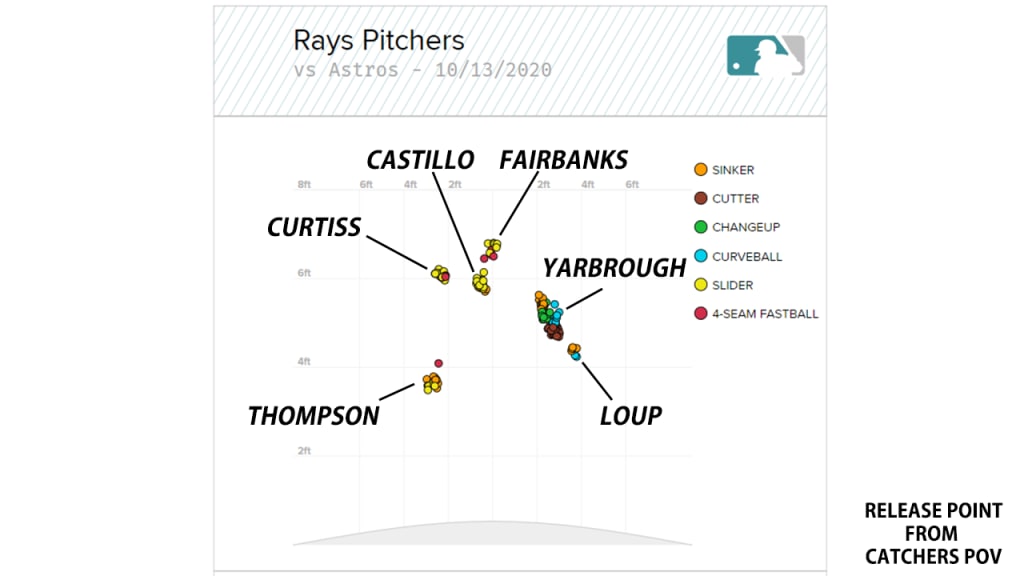
Two days later, in Game 3, the Rays did it again.

How unusual is this -- and does it matter?
With the help of Tom Tango, MLB.com's Senior Data Architect, we took a look at each pitcher this year (regular season and postseason) who threw at least 300 pitches. Then we looked at their average release point and identified the number of pitchers on each team who had a release point within six inches of one of their teammates. That is: Are you throwing similarly to any of your teammates? Or are you all out there on your own?
In 2020, the Rays, had 14 pitchers throw 300 pitches. Seven of them had a release point that wasn't within six inches of any of their teammates (Ryan Yarbrough, Josh Fleming, Charlie Morton, Aaron Loup, Ryan Thompson, Snell and the now-injured Jalen Beeks), making them unicorns on their own staff. That was the most in baseball.
Six more had a release point that was within six inches of only one of their teammates (Fairbanks, Castillo, Curtiss, Tyler Glasnow, Aaron Slegers and Trevor Richards). That was also the most in baseball, though tied with several other teams.
Only Anderson, who was within six inches of two teammates (Fairbanks and Castillo), stood out. So of the Rays' 14 regular pitchers, 13 of them had what you might call a "unique" release point.
You won't be surprised to know that by this method, the Rays had the most unique release points in the game. But what's interesting here is when we list out the top of the 30 teams, because you'll notice something about the top five: Three of the teams made it to the LCS this season.
Most pitchers with "unique" release points, minimum 300 pitches
13 -- Rays
10 -- Dodgers
10 -- Giants
10 -- Rangers
9 -- Braves
("Unique" meaning not within six inches of more than one's teammate's release)
Now, let's be clear about what that says and what it does not; the Giants and Rangers, for example, only had 10 pitchers throw 300 pitches, while the Dodgers had 13 and the Braves 18. So if we'd ranked this on a percentage basis, the Giants and Rangers would be first. Second, this isn't exactly a 1:1 relationship to success, because the Indians were near the bottom, and they had excellent pitching this year.
Still, it's interesting, and it matches the eye test that "the Rays have a ton of guys with very different looks."
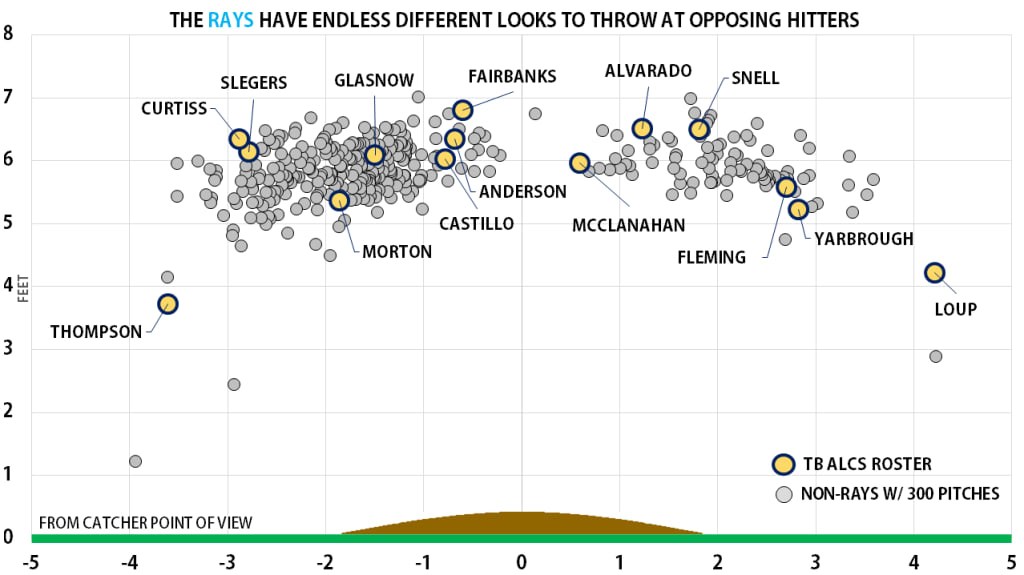
If we look at this another way and find all pitchers who threw 300 pitches from the other 29 teams, overlaid with Tampa Bay's ALCS roster, you can see what Cash has to work with. There's a pitch from absolutely every angle and location here.

You can tell, just by the visual there, that some of these guys stand out among the rest of the league. Let's explain how.
• Loup's horizontal release point (4.21 feet from the center of the mound) is the second-most extreme of any lefty, behind only San Diego's Tim Hill.
• Thompson's horizontal release point (3.72 feet) is tied for second-most extreme of any righty, behind San Francisco's Tyler Rogers.
• Both Loup and Thompson are among the six lowest release points.
• Fairbanks (6.8 feet) has the third-highest vertical release point in baseball -- 2.5 feet higher than Loup's.
• Snell (6.5 feet) has the seventh-highest release point among lefty pitchers.
• The 6-foot-10 Slegers is baseball's tallest pitcher (minimum five innings) -- and Glasnow is tied for second.
This isn't even the entire story. This doesn't include Ryan Sherriff, who didn't make the ALCS roster, and has a low left-side release of his own. It doesn't include the recently designated for assignment Oliver Drake, who throws so far from the first-base side of the rubber with a straight overhead release that he's basically a righty throwing from a left-handed slot. It doesn't include injured righty Chaz Roe, who throws the game's most-breaking slider from a high righty slot.
And while it's not shown here, Glasnow gets off the mound further than any pitcher in baseball, with 7.6 feet of extension off the rubber towards the plate, more than a foot greater than the Major League average.
Tampa Bay is a land of contrasts, clearly. Meanwhile, the Rays' ALCS opponents, the Astros, didn't appear high on that list above of unique pitchers. In fact, they had only one pitcher who was at least six inches away in release point from all of his teammates -- lefty Brooks Raley, who throws from the first-base side of the mound.

That's all, anecdotally, interesting. But does it help? Oddly enough, this is a topic that's rarely been researched over the years, to the point that despite reaching out to several respected public and private analysts, we couldn't find a single good study to share.
"We are convinced that different looks through an order, challenging lineups, gives us a good chance. We are confident that this is going to help us win games," Cash said following the 2018 season, in regards to the then-new use of the opener strategy. "If we can do something better for the team and give different looks on a consistent basis, we found it was more challenging for the opposition, the lineup."
“When you walk into the box, you’re trying to do something totally different than you’ve done all game," said 17-year Major League veteran Cliff Floyd when this topic came up on MLB Network before Game 4 of the ALCS. "You go up to the plate, and I’m thinking, ‘Do I get closer to the plate? Do I go back in the box? Do I move up in the box so I can catch the ball before it breaks?’ All these things, they’re to the advantage of the pitcher.”
We can't specify the exact impact of all of this here, because it gets complicated once you realize you have to account for the quality of the pitcher. (That is: If Josh Hader followed Jacob deGrom, you wouldn't exactly attribute their likely success to them looking so different, at least not more than their talent.) But we can say that maybe this is something else to consider when we think about the endless stream of pitchers into and out of a game, and what that's done to hitters.
After all, 2020, despite being a mere 60-game regular season, saw 735 pitchers appear, the fifth most of all time. And for years, batters have been seeing a higher share of their plate appearances coming against a reliever they were seeing for the first time. Right after World War II, just under 17% of all plate appearances were from a reliever in his first time through. That number didn't get above 25% for good until 1981, before it moved slightly upward over the next quarter-century, and then, like everything else in baseball, shot upward around five years ago.
Percent of plate appearances facing a reliever, first time through
1985 -- 26.9%
1990 -- 29.1%
1995 -- 31.3%
2000 -- 31.7%
2005 -- 31.6%
2010 -- 32.1%
2015 -- 34.0%
2016 -- 35.5%
2017 -- 36.7%
2018 -- 38.5%
2019 -- 40.1%
2020 -- 42.9%
Unless this trend stops -- and there's no reason to think it will -- we're coming up on half of all plate appearances coming against relievers who are seeing a lineup for the first time. We've always figured that shorter appearances allowing for higher velocity was the primary cause of the steadily increasing strikeout rate, and it almost certainly is. Maybe, however, it's a little about this, too. There's so many pitchers. There's so many different kinds of pitchers.
Cash, clearly, is convinced. It's not like Tampa Bay acquired all of these pitchers by accident. The Rays don't do anything by accident. They're just a single game from the World Series.
