

Baseball in October is still baseball ... mostly. It retains the general properties of the sport of baseball, anyway. Regulation games remain nine innings, there are three outs per inning, four balls make a walk, etc. It's played in the same stadiums, with the same teams.
But if it doesn't look like regular-season baseball, that's because it's not. It's not a leisurely summer afternoon, one of 162 games over six months. It's baseball turned up to 11, then shot out of a helicopter, into the sun, with fireworks.
Some of those reasons are obvious. It's just the best teams -- lots of Dodgers and Yankees, no Orioles or Tigers. It's just the best players on those teams -- no third-string catchers or Quad-A relief arms. It's the best pitchers on those teams with extra rest, and without needing a struggling starter to wear one to "save the bullpen." It's baseball, mostly -- it's just a hyper-pressurized version of it.
But we don't have to reduce ourselves to half-true clichés like "good pitching beats good hitting" or "small ball works better in the playoffs." We have numbers, we have data and we have facts. What really happens when the calendar flips to October? Here are nine reasons October baseball is so different from regular-season baseball:
1) Relievers take over the game.
This has been happening in the regular season for several years now, as the line between starter and reliever continues to blur. Just four seasons ago, in 2015, there were 104 complete games. That isn't that long ago, and yet it is more than we've had in the last two seasons combined (86).
You already know that this gets turned up a notch in October, because we saw the A's use an opener in the American League Wild Card game last year, because Aaron Boone is already openly talking about the Yankees -- the Yankees! -- possibly only using "one traditional starter" in the playoffs, because the idea of a starting pitcher taking a Game 7 into the 10th inning, as Jack Morris did in 1991, seems like an idea from a different planet entirely at this point.
You know this, because you hear the quotes and you watch the games, and yet the numbers are still somewhat stunning. In 1995, the first year of the Wild Card era, relievers pitched 33.7 percent of regular-season innings and 32.8 percent of postseason innings. That share bounced around a little over the years but held mostly steady. In 2010, for example, their 32.9 percent regular-season share of innings and their 32.3 percent postseason share of innings was essentially equal.
It began to take off from there, and now ...
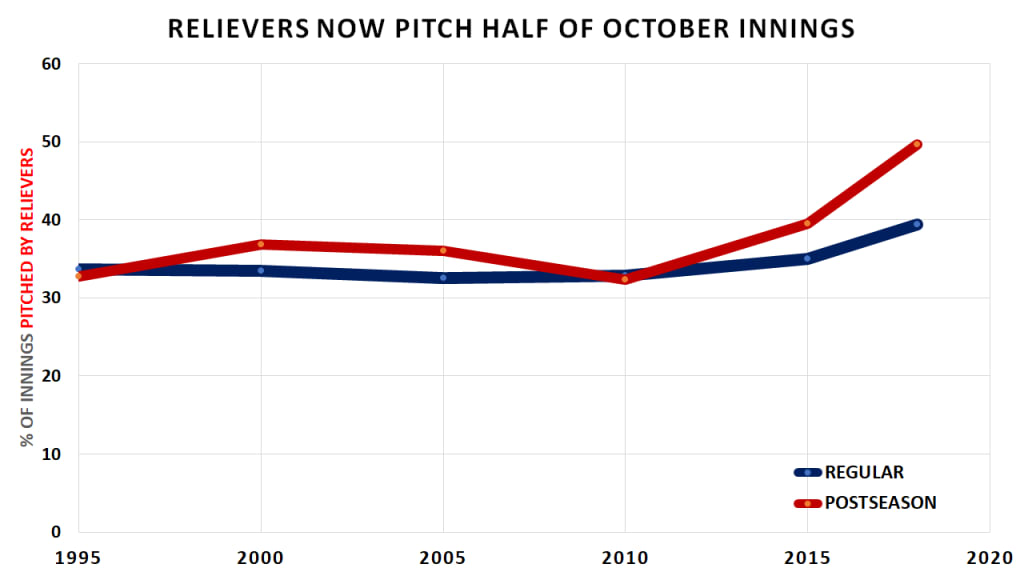
... we have reached a 50/50 split, at least in October. In 2018, relievers pitched 39.4 percent of regular-season innings. In the postseason, they pitched 49.7 percent of innings. Assuming that's not a one-year fluke -- and there's little reason to think it would be -- we have officially reached the point where October isn't about starters and relievers. It's about pitchers. It's about out-getters.
2) Fastballs get faster.
This should just be the least surprising thing, right? Only the best pitchers are on the mound and, with the extra days off, are often well-rested. Save for a Kyle Hendricks here or a Hyun-Jin Ryu there, the best pitchers tend to throw hard. Relievers, as we just showed, are used more aggressively. Starters rarely go more than a few innings; sometimes hard-throwing starters such as Chris Sale and Nathan Eovaldi take the place of unimpressive relievers. Velocity comes with all of that.
We have 11 years of pitch-tracking data now to back this up. In the regular season, four-seam fastballs since 2008 have averaged 92.7 mph. In the postseason, that has been 93.7 mph. Every single year, the average velocity has gone up in October. Last year, the gap was 1.6 mph, the largest on record.
This stands out a lot more, however, if you look at it in a slightly different way. Rather than average fastball velocity, a more interesting view is percentage of four-seamers thrown at least 95 mph. To take the extremes here, the 2008 regular season: 16.3 percent, the 2018 postseason: 51.2 percent.
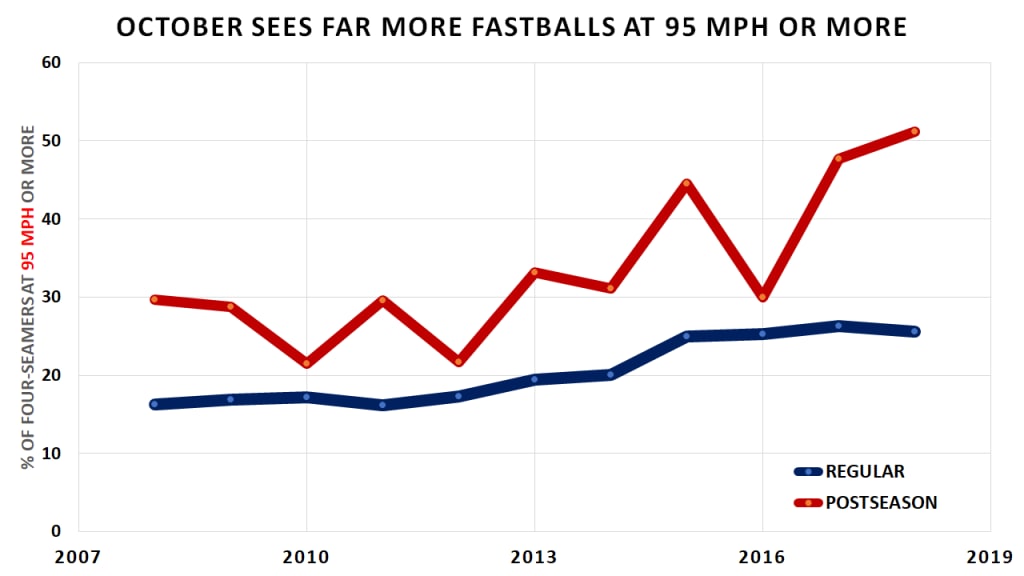
Last October, more than half of all four-seamers arrived with at least 95 mph of heat. If you're wondering if that's a big deal, it is. As a group, Major League hitters this year are hitting .243 with a .423 slugging on four-seamers 95 mph and above, and .282 with a .529 slugging on four-seamers 94 mph and below.
In October, there are more fastballs that are harder to hit. It's as simple as that.
3) Curveballs have more spin and are more plentiful.
As we started with, everything in October is just more. That's true with fastball velocity, and it's true with breaking pitches, too. This is pure selection bias: The pitchers who do a certain thing less effectively are less likely to be pitching in October.
If we look at the improvement in curveball spin rate from regular season to postseason in the four years we have tracking, we can see two trends. First, there's a clear increase in October. Second, that increase is getting larger each year.
2015: +52 rpm
2016: +93 rpm
2017: +125 rpm
2018: +169 rpm
Now, curveball spin by itself does not make for success, in the same way that fastball velocity alone doesn't guarantee success. But there's still an effect here. For example, if we look back at 2018, we can see that the regular-season average curveball spin was 2,496 rpm and the postseason spin was 2,665 rpm. Let's see what the outcomes are in 2019 on curves above and below those spin marks. You're going to want to pay attention to this one.
Above 2,650 rpm: .202 BA/.318 SLG/33.6 percent whiff rate
Below 2,500 rpm: .246 BA/.426 SLG/29.8 percent whiff rate
Curveball spin isn't everything. It's not nothing, either.
There's also more of them, too. Over the last five years, regular-season curveball usage has gone up by a little, but not a lot -- from 9.8 percent in 2015 to 10.9 percent in 2019. But at the same time, postseason curveball usage has gone up even more, with last year checking in at 14.3 percent. That might not sound like a lot, but in raw terms, we saw 271 more curves in the 2018 postseason than in 2015.
So, you have more pitchers throwing harder fastballs and more curveballs with more spin. Guess what that leads to?
4) Strikeouts go up.
Right. Of course they do. This is frustrating for fans in October, seeing their favorite hitters whiff more and perform worse. Then again, they're facing a far higher caliber of pitcher than they do all year. This should be the expectation, not a surprise.
This has been true for years, of course. Other than an odd dip in 2014, strikeout rate has increased in October every season for the last 12 years.
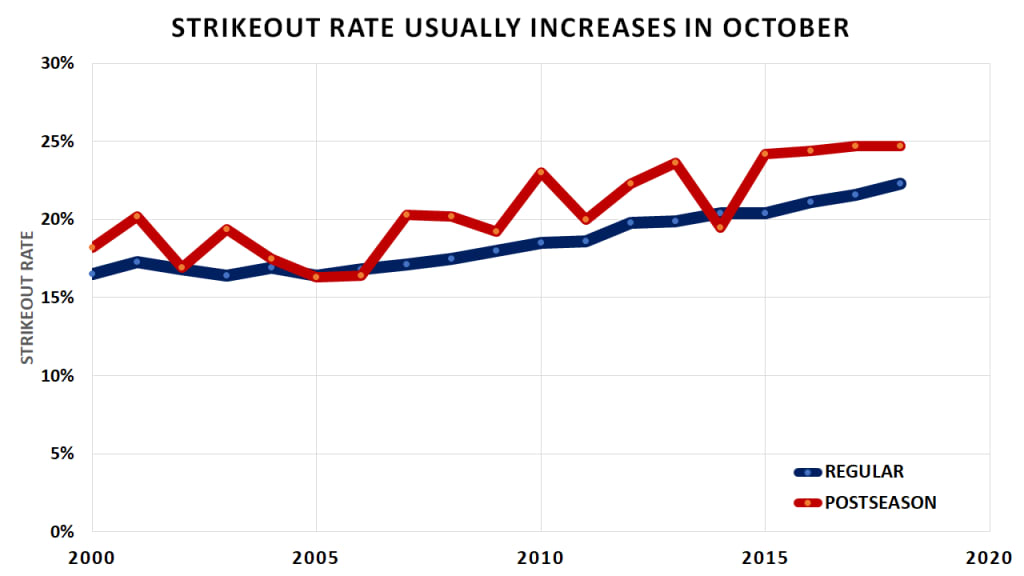
What's interesting here is that they might be going up more. Dating back to 2000, the average increase in strikeout rate is 2 percent. In the last four seasons, the increase is 3.2 percent.
So all of these forces conspire to make life for hitters more difficult. How else can we give them a hard time?
5) Defenses get better.
Again: better teams, with better players, playing only their best players. This should be self-explanatory, right? If you have a poor defense, you're not likely in the postseason. Just look at the Defensive Runs Saved leaderboards: The Dodgers, Cardinals, Indians, Rays, and Astros are at or near the top. The Tigers, Mariners, Mets, and Orioles are at the bottom. Surely, you know which set of teams will be starting the offseason after this weekend.
But how do we measure that in October? Given the small samples, there's not one perfect way. There's not really a "postseason DRS." There are a few decent ways, though:
5a) Batting average on grounders goes down in October.
This should be simple enough: Batting average is flawed as an overall value stat, but if you're just talking about "how often grounders turn into hits," it gets the job done. In each of the last four years, postseason average on grounders is lower than it was in the regular season, by an average of 24 points. In 2017, it dropped all the way from .249 to .205.
2015: -.009 (.249 regular, .240 postseason)
2016: -.028 (.250 regular, .222 postseason)
2017: -.044 (.249 regular, .205 postseason)
2018: -.016 (.246 regular, .230 postseason)
So far as infielders go, that says a lot about better skill, or at least positioning, than we see in the regular season.
5b) Flies and line drives find more gloves.
OK, so what about outfielders? Let's look at fly balls and line drives -- excluding home runs -- that went at least 300 feet, as a proxy for balls hit to the outfield. Remember when we said average on grounders dropped by 24 points? For these, it's a nearly-identical 22 points.
2015: -.023 (.230 regular, .207 postseason)
2016: -.012 (.241 regular, .229 postseason)
2017: -.015 (.238 regular, .223 postseason)
2018: -.036 (.223 regular, .187 postseason)
You're not reading that wrong. Last October, non-homer flies and liners hit at least 300 feet fell for hits less than 20 percent of the time.
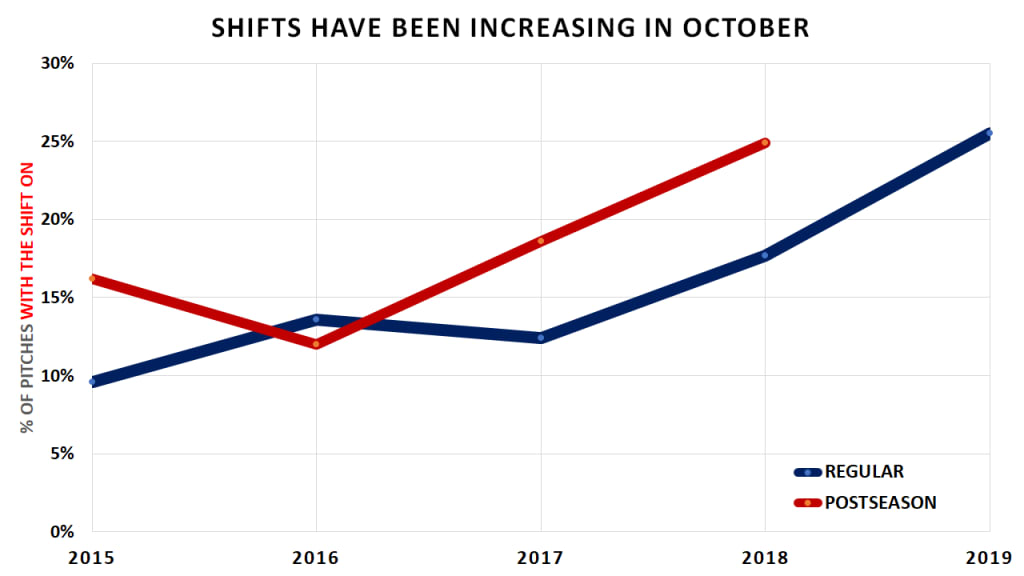
6) There are more shifts.
Part of that improved defense is certainly about having only strong defenders on the field; this October, you'll see defensive studs like Victor Robles and Matt Chapman. You'll also see a lot more nontraditional infield defenses. You'll see shifts, which we define as "three infielders to one side of second base."
We have four years of solid shift tracking data, and in the regular season, it has edged up bit by bit. In 2015, just under 10 percent of pitches were shifted, a number which rose to 17.7 percent by 2018. Other than 2016 -- perhaps largely due to the success of the non-shifting Cubs -- postseason shifting has been up by 6 percent to 7 percent each year.
This year, by the way, regular-season shifts have gone up to 25.5 percent. If the pattern holds true, we might see shifts more than 30 percent of the time. It might even be more than that, because the two teams that shift most often this year are the Dodgers and Astros.
7) Passed balls and wild pitches go up.
Remember: It's already likely more difficult than ever to be a Major League catcher. Last month, we looked into how Seattle catcher Omar Narváez had shattered the all-time record for most pitchers caught in a season, which now sits at 41, and the impact all of the extra pitchers, velocity, and spin has had.
The 2018 regular season had the highest rate of combined passed balls and wild pitches per game ever. This season is going to come in only slightly below that.
But that's just the regular season. We've discussed how October features more velocity, more spin, more curveballs. Guess what that does to catchers? While Yasmani Grandal drew a lot of attention for his National League Championship Series defensive breakdown, he was hardly alone. As FanGraphs dug into in great detail last October, passed balls and wild pitches in October have exploded. Just look at this line: "Balls are getting to the backstop with runners on base in this postseason nearly twice as often as they did a decade ago."
It's always difficult to be a catcher. It's especially difficult in October.
8) Batted balls get hit harder.
It's not all bad news for batters. When they put the ball in the air -- we're talking fly balls and line drives here, which is really where this matters -- they're hitting it hard more often. (That is to say, they're hitting it at 95 mph of exit velocity or more, more often.)
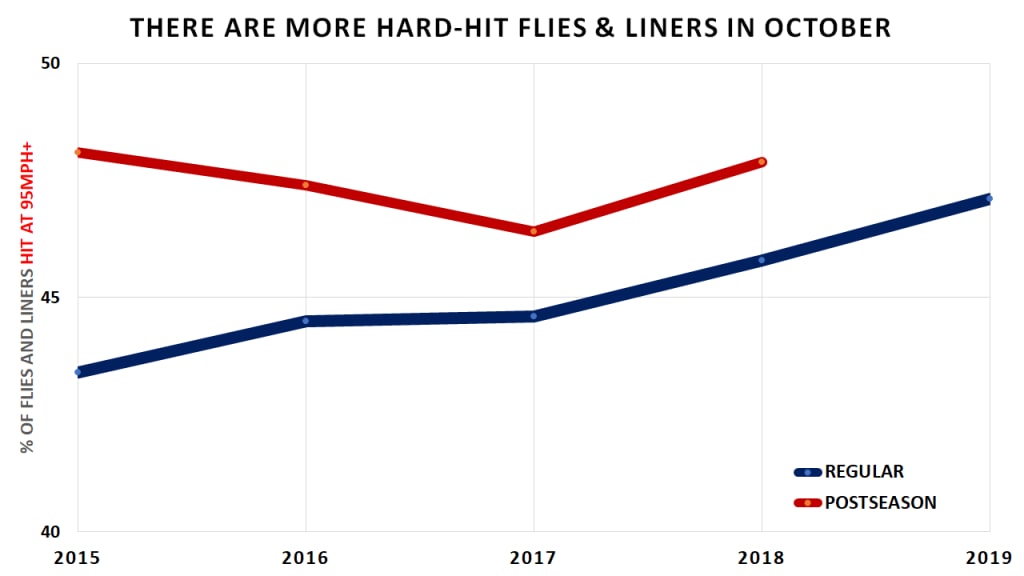
This is a big deal, because about 96 percent of home runs come on hard-hit flies and liners, as you'd expect. Hard-hit rate on flies and liners is already up to 47.1 percent in the regular season this year. Might we see 50 percent in October?
Part of the reasoning here is likely about the fact that we're likely to see more powerful hitters in October, while the weaker ones ride the bench or stay home. But it might also be a strategy, too. If it's more difficult to make contact, and more difficult for batted balls to find grass rather than gloves, and nearly impossible to string together a rally of multiple hits against high-quality pitchers, why wouldn't you try to bash a homer?
9) Offense goes down.
This is it. This is the entire game. This is what it all leads to. If your favorite batter or lineup does worse in the postseason than they do doing the regular season, that's because the system is set up that way. They're facing better pitchers who are being put in better position to succeed in front of better defenses. Even the weather works against them -- every 10 degrees the temperature drops can cost a little more than three feet of distance.
Last year's champion Red Sox, for all the talk about putting the ball in play, hit just .242/.327/.397 in October. That's a .724 OPS. You know who has an OPS at or near that this year? Starlin Castro. Brandon Dixon. César Hernández. These are not exactly star-level hitters.
Think about it this way: Last year, in the regular season, non-pitcher Major Leaguers batted .252/.323/.417. That's a .740 OPS, or essentially what Alex Gordon (.741) is doing this year.
Last year, in the postseason, non-pitcher Major Leaguers batted .218/.303/.357. That's a .660 OPS, or essentially an entire league hitting like Albert Almora Jr. this year (.663).
You can see how much of a difference that is, and you can see how commonplace this is. Over the last decade, the postseason OPS has been 43 points lower on average than in the regular season. It has been lower in the postseason in 12 of the last 13 years. (The 2011 postseason is a weird outlier, which we'll put on the Cardinals scoring 100 runs, the most in postseason history for an NL team.)
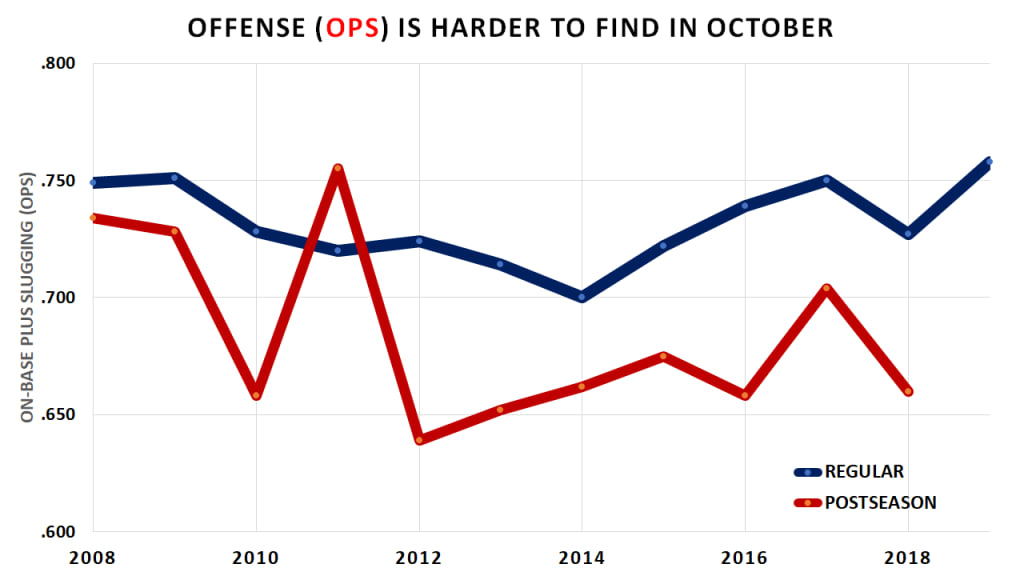
As you'd expect, this all translates to runs per game. Since 2008, we've seen teams average 4.43 runs per game in the regular season and just 4.04 runs per game in the postseason.
Again, this is a feature, not a bug. It's all set up this way. Better pitchers get to throw harder, better pitches on more rest. They get to do it in front of better defenses and more shifts. The caliber of hitter goes up, but they don't get the same added benefits. What happens in October, for the most part, is "more." But what happens for hitters is often "less." It's the way it's set up to be.