

At one point in the fourth inning of a game last August, a fan in the stands at Comerica Park -- likely a Tigers fan trying to mess with the mind of Cleveland pitcher Triston McKenzie -- made a loud announcement.
“Hey, McKenzie!” the fan yelled. “You’ve got a no-hitter going!”
McKenzie was already aware that he had not allowed a hit the first time through the Tigers’ order. But when he heard that information reported so rambunctiously by the fan, it occurred to him that he hadn’t given up a walk, either.
“I’ve got a perfect game going,” McKenzie thought to himself. “Screw your no-hitter!”
That’s how we all feel about no-hitters when a perfect game is legitimately on the line.
No-hitters are impressive and special and, even on the heels of a 2021 season in which we saw a record nine of them, still relatively rare.
But compared to a perfect game? Please.
There have been 316 officially recognized no-hitters (including two this season), but only 23 of them (including postseason) were perfect games. And in the last 10 years, the distinction between the two has been especially, frustratingly clear.
Since Félix Hernandez finished off the third perfect game of the 2012 season on Aug. 15 of that year, we have had 38 no-hitters, yet not a single perfect game. (McKenzie’s effort, which just so happened to fall on the ninth anniversary of King Félix’s feat, came four outs shy, when Tigers shortstop Harold Castro lined a clean single to right with two outs in the eighth.)
And so our perfect game paucity continues -- and it is beginning to become historically significant. Only twice since 1901 have there been at least 38 consecutive no-hitters without a perfect game:
- Between Charlie Robertson’s April 30, 1922, perfect game for the White Sox and Don Larsen’s Oct. 8, 1956 perfect game during the World Series for the Yankees (42 no-hitters in-between).
- Between Catfish Hunter’s May 8, 1968, perfecto for the A’s and Len Barker’s May 15, 1981 perfecto for Cleveland (also 42 no-hitters in-between).
We are creeping up on the record for most consecutive no-hitters without a perfect game. So how the heck did we get here? A decade ago, such a drought didn’t seem possible.
The 2012 season can safely be described as the Year of the Perfect Game, because it was the only season in history with three of them -- Philip Humber’s totally unexpected gem for the White Sox against the Mariners on April 21, Matt Cain’s perfect game for the Giants against the Astros on June 13, and Hernandez’s heroics for the Mariners against the Rays. There were also perfect games tossed by the A’s Dallas Braden and the Phillies’ Roy Halladay within 20 days of each other in May 2010, and those came on the heels of Mark Buehrle’s perfect game for the White Sox in July 2009.
Back in 2009-12, it began to feel as if the perfect game was losing some of its prestige. But now we’re closing in on a decade without one, despite the leaguewide on-base percentages in recent seasons ranking among the all-time lows (as of this writing, the leaguewide .308 OBP would be the third lowest of the live-ball era).
On the surface, it doesn’t add up. And it would be tempting to suggest that, as was apparently the case in 1922, 1956 and 1981, we are just about “due” for a perfect game. Perhaps we are.
But you don’t go from feast to famine entirely by accident. So let’s delve into five reasons why the perfect game has proven so elusive in MLB the last 10 years.
1. We’ve had soooo many close calls
First and foremost, let’s be clear: Luck has not been on our side.
Consider that, since 1901, there have been 33 instances in which a pitcher lost a perfect game in the ninth inning or later. Amazingly, eight of those instances -- or 24.2% -- have occurred just in the last 10 seasons. Here they are and those with an asterisk indicate the pitcher completed the no-hitter.
• Yu Darvish, TEX, 4/2/13 (hit with 2 out)
• Yusmeiro Petit, SF, 9/6/13 (hit with 2 out)
• Max Scherzer, WSH, 6/20/15 (HBP with 2 out in 9th)*
• Rich Hill, LAD, 8/23/17 (error with no out in 9th)
• Jorge López, KC, 8/8/18 (walk and hit with no out)
• Ryne Stanek / Ryan Yarbrough, TB, 7/14/19 (hit with no out)
• Mike Leake, SEA, 7/19/19 (hit with no out)
• Carlos Rodón, CWS, 4/14/21 (HBP with 1 out)*
That’s a lot of woulda shoulda couldas.
And while none of the above are as egregious as the infamous umpiring error that robbed the Tigers’ Armando Galarraga of a perfect game on June 2, 2010, the Scherzer and Rodón hit by pitches did cause some controversy. The Pirates’ Jose Tabata clearly angled his left elbow in the direction of a Scherzer slider and got plunked. Cleveland’s Roberto Pérez got hit in the foot by a literal backfoot slider from Rodón that was probably unavoidable but still unfortunate.
So while there are various statistical reasons why perfection has been unattainable in recent years (and we’ll get to those in just a sec), the simplest explanation for the drought is that baseball is a game of inches, and we’ve collectively come up short.
The baseball gods are laughing at us, folks.
2. Batters are going deep
No, not just in hitting dingers, but in working counts.
The average plate appearance in 2012 was 3.82 pitches. Last year, it was 3.90, and this year (as of this writing) it’s 3.91. The percentage of pitches thrown in full counts was 4.6 in 2012. Last year and this year, it’s 5.0. The percentage of pitches that result in a foul ball in 2012 was 16.7. Last year, it was 17.7 and this year it’s 17.6. And of course, strikeout rates have been at historical highs in recent years. In 2012, 19.8% percent of plate appearances ended in a strikeout. Last year, it was 23.2 -- the highest ever for a full season.
What this all amounts to is more pitches for the same number of outs. And while that obviously hasn’t hindered the no-hit parade, it does reduce our odds of witnessing a perfect game. After all, the deeper the count, the higher the likelihood of a walk.
3. It’s wild out there.
One of the absolute biggest changes in baseball since we last saw a perfect game is the way pitchers attack opposing batters. Fastballs are being thrown harder now than they were then, but they are being thrown much less frequently.
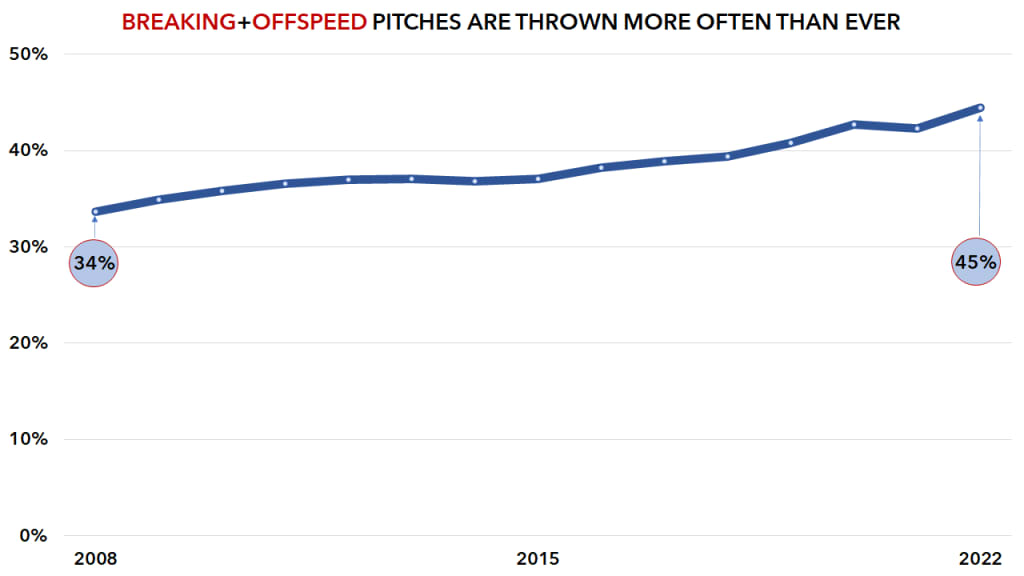
No doubt, this approach is working. Between the increase in breaking and off-speed pitches and the aggressive defensive shifting that has come into vogue, the leaguewide batting average has plummeted. In 2012, it was .255. Last year, it was .244 -- the lowest mark since 1972. This year, the average through the first six weeks of the season was .235, on pace to “beat” 1968 (.237) for the lowest average of all-time. No wonder there are so many no-hitters.
The problem from a perfect game perspective, however, is that pitchers don’t command breaking and off-speed pitches as well as they command fastballs.
PERCENT OF PITCHES THROWN FOR STRIKES (SINCE 2008)
Fastballs: 51.8%
Breaking: 44.7%
Off-speed: 40.7%
“Guys today, we're less worried about walks,” McKenzie says. “Guys are trying to showcase their stuff and get outs. I think guys in the last 10 years have seen what gets them paid. If that’s the strikeout and it leads to a couple more walks, they’re not too worried about it. And that leads to them not being as consistent in the zone from pitch one to whatever pitch it would take to get a perfect game.”
4. Pitchers have been pulled with perfectos
We would be remiss if we didn’t mention two anomalies that have occurred within this 10-year window. Rich Hill was removed with a perfect game intact against the Marlins due to blister issues on Sept. 10, 2016. And Clayton Kershaw was removed after seven perfect innings against the Twins on April 13 of this year, in his first start of the season after dealing with forearm inflammation last season.
Those are the only two times in history in which a pitcher has been pulled with a perfect game intact after seven innings. And both times, Dodgers manager Dave Roberts did the pulling.
Given the direction the game has gone in terms of pitcher protection, Roberts is more symptom than cause. The complete game has, of course, become a rare bird. In the last three full seasons (2018, 2019 and 2021) combined, there were 137 complete games -- or just nine more than in the 2012 season alone.
Again, this hasn’t prevented no-hitters from occurring on a semi-regular basis. But evidently, it’s easier for a bullpen to finish off a no-hitter than a perfect game. Six of the last 19 no-hitters were combined efforts, and there has never in history been a combined perfect game, as the Dodgers ‘pen was not able to finish what Hill and Kershaw started.
Should another pitcher ever be pulled with a perfecto, keep this in mind: When the call is made to the bullpen, the likelihood of a walk rises. In the last 10 seasons, starters have walked 7.6% of batters faced, while relievers have walked 9.2%. Last year, starters walked 7.8% of batters and relievers walked 9.8%.
5. We’ve actually already had plenty of perfect games
Finally, we asked Tom Tango, MLB’s Senior Data Architect, if he could calculate the probability of a perfect game.
Fair warning: His response contains the kind of mathematical jargon most of us should have retained from high school. As it stands, we’re going to have to take Mr. Tango’s word for it:
“Let’s say OBP, including reached on error, is .333. This means getting 27 straight outs is .667^27, which is over 50,000 to 1. However, a great pitcher would have an OBP under .300, so 27 straight out is 15,000 to 1. A great pitcher with a .270 OBP is 5,000 to 1. A bad pitcher would naturally be way over 50,000 to 1. So there’s a distribution here that is not symmetrical. If you take the average of all pitchers, the odds are going to be closer to 20,000 to 1.
“With 162 x 30 team games, that’s almost 5,000 games. So I’d expect one perfect game every 4 years with 30 teams. With 16 teams, that’s closer to one every 8 years.
“So historically, that probably works out to one every six years, and over the last 120 years, I’d therefore expect about 20 perfect games.”
Uh, what he said.
The bottom line, if this math checks out, is that we’ve had 21 perfect games in the last 120 years (not counting the two in the 1800s) when we “should have” had 20.
Why, that’s… almost perfect.