

Jose Altuve stood for six seasons between 2014-'19 as one of the game's best players, but like so many others, he struggled through a poor 2020, by his standards or anyone else's. Altuve hit a mere .219/.286/.344, giving him a Weighted Runs Created Plus (that's the catchy acronym wRC+ you'll see here) of 77, and since that metric is set so that "100" is league-average, it meant he was 23% worse than the average hitter. Over the previous six years, he'd always been between 24% better than average (2015) and 60% better (2017). His prowess was matched only by his consistency, making that '77' really stand out on his stats page.
But what if Altuve wasn't really 23% worse than average in 2020? What if he was actually 12% better than average? How differently would you feel about him going into 2021 if his past three seasons of wRC+ went "135, 139, 112" as opposed to "135, 139, 77"? Probably a lot.
You can get there, if you think about doing something you'd usually never do. We're talking about looking at the playoffs, and Altuve was great in the playoffs. Defensive issues aside, Altuve mashed five homers. He hit .375/.500/.729 over 60 plate appearances, mostly off top-end pitching. (Two of the homers came off of Blake Snell and Tyler Glasnow.) He was fantastic.
So: Should that matter? Usually, no. But nothing about 2020 was "usual."
In normal seasons, we don't pay much attention to postseason stats, at least in terms of player evaluation. That's because in a normal season with a normal playoff structure, we're talking about a drop in the bucket.
For example, in 2015, Altuve had 689 regular-season plate appearances and 27 more in the playoffs, which meant that 96.2% of them were in the regular season. Given the inequality (not every player gets a shot to get to the playoffs) and differences in playing strategy, we're usually comfortable brushing those aside. They matter in winning those important games, but not so much in projecting players for the next year.
But ... 2020 was not a normal season, in so many ways. Rather than 162 regular-season games, there were 60. Rather than a single-game Wild Card and three rounds of playoffs, we had expanded playoffs. (Of the 18 players with the most plate appearances in a single postseason, five took place in 2020, led by Randy Arozarena's all-time high of 86.)
In 2020, if we're skipping Altuve's postseason, we're not skipping two or three or four percent of his season. We're skipping nearly 23% of it, given that he had 210 plate appearances in the regular season and 60 more in the playoffs, and maybe that's not something you'd really want to do in a year where every sample size is too small. To be clear, this is not the start of a new evaluative normal; in a normal-length regular season you probably still wouldn't do this. But for 2020, a year where nothing made sense, it might at least be worth looking at. Maybe Altuve's "bad season" was really "a decent one." Maybe he's not alone in that.
So that's what we did. We looked at every player who had at least 40 regular-season plate appearances and five postseason plate appearances, which gave us 158 hitters. Then we weighted each player's regular and postseason wRC+ by how many plate appearances they had in each. (For example, Altuve had a 78%/22% regular/postseason plate appearance split, while Josh Naylor had a 94%/6% regular/post split, and Arozarena had an absolutely hilarious 47%/53% split, since he had more October plate appearances than he had in the regular season.)
We combined both sides, and we came up with a new seasonal average. (It's fair that wRC+ might not be the perfect way to do this, given that it's park-adjusted and many postseason games weren't in regular home parks, but we wanted to keep it to a stat pinned to 100 as average rather than raw OPS or wOBA.)
In Altuve's case, that looks like this: His regular season 77 wRC+ gets the heavy side of the 78%/22% split, his postseason 235 wRC+ gets the light side, and it's all applied over 270 total plate appearances. End result: 112 wRC+, 12% above average, or roughly what Cody Bellinger (114 wRC+) just did. Maybe that would make you think differently about him headed into a new season.
So: Who had a 2020 that looks better now than maybe you would have thought? Who looks worse? Here's what those 158 hitters look like, in terms of whether their season line improved or worsened once postseason numbers are weighted and added in. It's busy, as you'd expect.
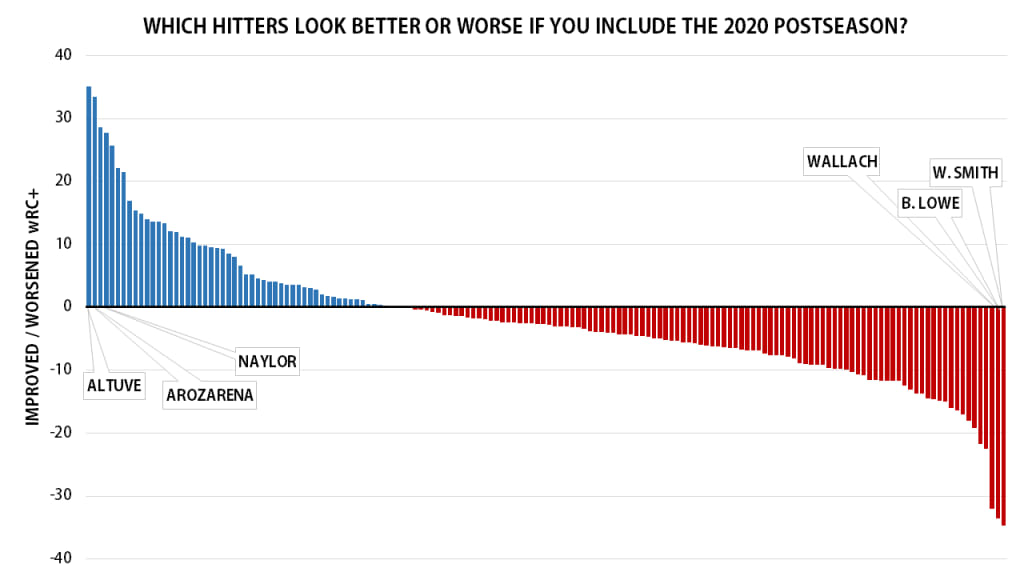
More guys got worse than got better, and that also makes sense, because as we've been saying for some time, offense always goes down in October. That was true in 2020 as well, as the regular season OPS was .740, and the postseason mark was .728.
So: Who had a 2020 that looks better now than maybe you would have thought? Who looks worse? You can look at our whole list here, but let's highlight some of the biggest differences.
The hitters who went from below-average to above-average
Eight hitters went from below-average lines (wRC+ under 100) to above-average (wRC+ above 100).
• Altuve (from 77 to 112, +35 points)
• Carlos Correa (from 98 to 124, +26 points)
• Chad Pinder (from 92 to 114, +22 points)
• Joc Pederson (from 88 to 105, +17 points)
• Manuel Margot (from 93 to 108, +15 points)
• Marcus Semien (from 92 to 107, +15 points)
• Aledmys Díaz (from 97 to 111, +14 points)
• Austin Barnes (from 94 to 103, +9 points)
Like his middle-infield partner, Correa had a disappointing season, though not quite to the extent that Altuve did, and also like his teammate, he mashed in the playoffs, posting six homers with a .362/.455/.766 line. That came in 55 plate appearances, or about 20% of his full-2020 work. Interestingly enough, Correa's full-career wRC+ is ... 127, making that combined 124 feel very right.
The most interesting pair here is Semien and Pederson, since they're both free agents coming off what seemed like disappointing platform regular seasons before hitting well in the playoffs. How differently might they be viewed if they were coming off above-average years than below-average ones?
The hitters who went from above-average to way above-average
OK, what about the hitters who already had good regular seasons, then were even better in October?
• Arozarena (from 176 to 209, +33 points)
• Giancarlo Stanton (from 142 to 170, +28 points)
• Gleyber Torres (from 106 to 128, +22 points)
• Corey Seager (from 152 to 166, +14 points)
• Brett Gardner (from 110 to 122, +15 points)
• Jake Cronenworth (from 125 to 136, +11 points)
• Tim Anderson (from 142 to 152, +10 points)
• Michael Brantley (from 135 to 145, +10 points)
These hitters all performed well when they were healthy in the regular season, and then did even more in the playoffs. (We'd almost forgotten that Giancarlo Stanton homered in five straight postseason games.) Arozarena's exploits have been well-chronicled, but Torres really stands out here, because after mashing 38 homers in 2019, it seemed like he took a big step back in 2020. And he did, but if you include his strong postseason, that gets his 2020 wRC+ up to 128 ... slightly better than the 124 he had in 2019.
The hitters who might wish the season had ended in September
• Will Smith (from 163 to 128, -35 points)
• Brandon Lowe (from 150 to 117, -33 points)
• Chad Wallach (from 76 to 44, -32 points)
• Tyrone Taylor (from 107 to 85, -22 points)
• Joey Wendle (from 116 to 94, -22 points)
• Austin Meadows (from 87 to 68, -19 points)
• Leury Garcia (from 108 to 90, -18 points)
• Willy Adames (from 124 to 107, -17 points)
There's a wide variety of players here, from those who went from great seasons to maybe only good seasons, to those who had bad regular seasons that might now actually look worse, and then also the case of Lowe, who looked so good in the regular season, so lost in the postseason, and then woke up in time to hit three home runs in the World Series.
Again, we're not advocating for using postseason numbers indefinitely into the future, especially not if and when we get back to 162-game seasons and possibly not-expanded playoffs. But in a year where no Major League hitters even managed a mere 275 plate appearances, and when the postseason lasted a month for the team in it the longest, it doesn't seem like we should completely ignore 20-30% of a hitter's plate appearances this year. It might just change the way you think about them.