

One hundred years from now, when baseball historians ruminate on the 2023 season while dodging dust storms in their Mars colonies, we can guess what they are most likely to observe.
With due respect to the great individual and team achievements we’ve witnessed and will yet witness this year, it’s the adoption of revolutionary new rules – the pitch timer, defensive shift restrictions and bigger bases – that serves as 2023’s most historically relevant development.
So … what have we learned from the new rules? What conclusions can we draw from the first season of the Pitch Timer Era and chronicle for our future Martian friends to find?
Here are a dozen observations.
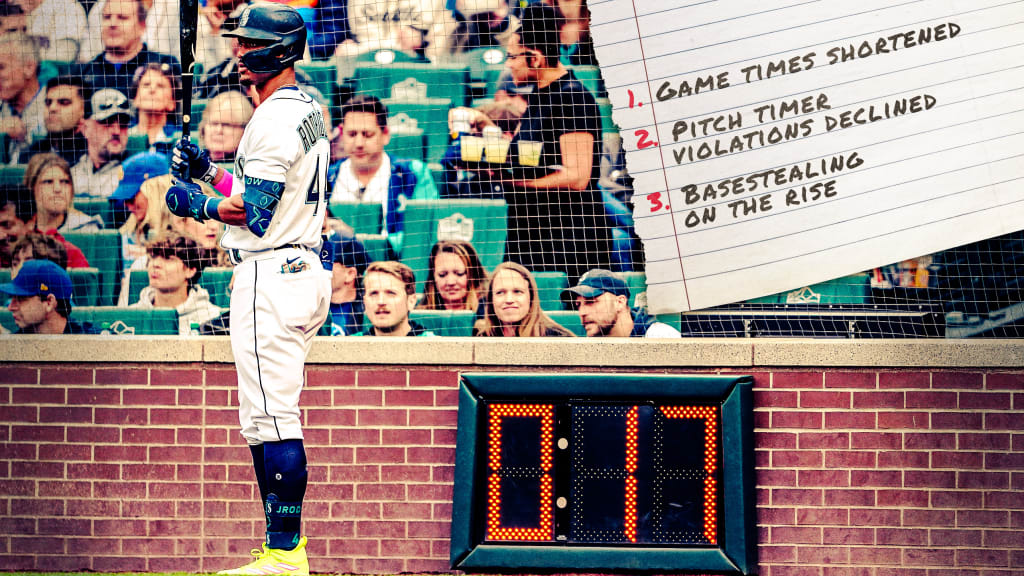
1) Obviously, game times shortened.
There is no bigger takeaway from the timer, of course. As of this writing, the average nine-inning game time is 2 hours, 40 minutes -- a decrease of 24 minutes when compared to the same number of games in 2022 and the lowest such average since 1985 (2:39).
If we control for the run environment and events that typically increase game time (such as mid-inning pitching changes), then the year-over-year decline in nine-inning game times is 26 minutes.
And if you go back to 2021, which was an all-time high of 3:10 per game, we are down a half-hour compared to two seasons ago.
2) Game times did lengthen slightly in the second half.
Digging deeper, we do see a rise in game times within 2023 as players became more familiar with the nuances of the timer rules. In the first three weeks of the season, the average nine-inning game time was 2:38. In the most recent three-week span, the average time was 2:44.
How has this happened? One veteran pitcher said that he’s learned to be comfortable stepping off the mound and using one of his allotted disengagements, rather than rush a pitch with a runner on base. That’s an interesting observation, because, as you’ll see later in this piece, the fewest violations have occurred between pitches with a runner aboard. When pitchers let the timer wind down and then step off, it adds 20 seconds to the at-bat. So that’s one example of how adaptation to the timer has slightly expanded game times within the season.
All that said… even if every nine-inning game were 2:44, that would still be the lowest average since 1986.
3) Pitch timer violations declined throughout the year.
Players adjust. That’s how they got to the big leagues in the first place, and they proved their adaptability as 2023 rolled along.
In the first batch of 100 games played, there were 0.87 violations per game (total for the two teams). In the most recent batch of 100 games, the rate was 0.34 per game. The rolling 100-game rate was never higher than that season-opening 0.87, and it got as low as 0.24 – or about one violation every four games played.
Overall, since the All-Star break, there have been 0.30 violations per game. Two-thirds of games played this season (66%, to be exact) had zero violations, and 74% of games in the second half had zero. Of the players who have thrown or seen 100 pitches this season, 49% of pitchers and 68% of batters have not committed a single violation of the timer rules. Good job, guys!
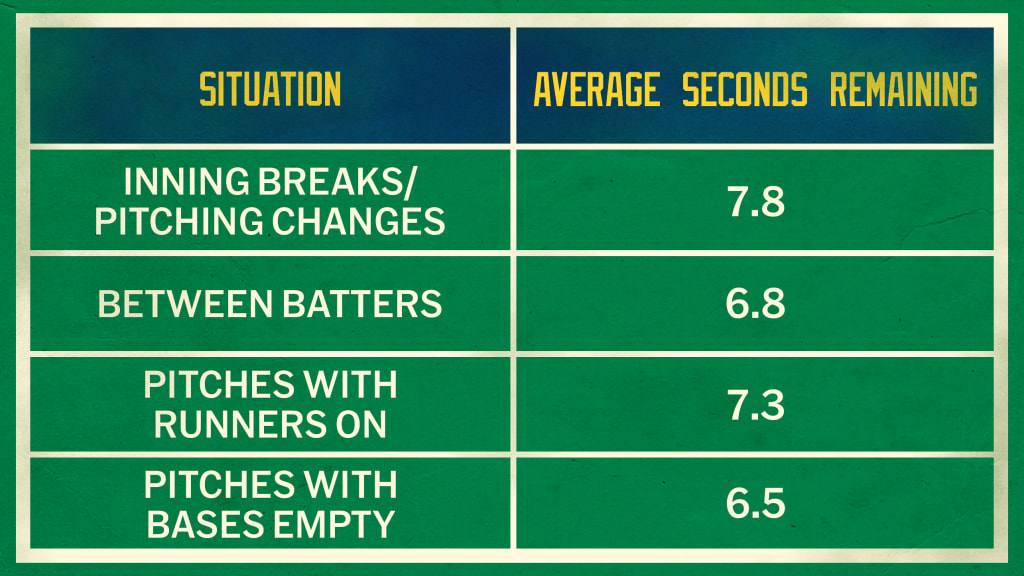
4) Relatedly, there has been plenty of time on the timer.
Though the players pushed for more time on the timer for the postseason, there is no statistical evidence that 15 seconds with the bases empty and 20 seconds with runners aboard is not sufficient. Pitchers have had, on average, anywhere from 6.5 to 7.8 seconds remaining on the timer when they begin their deliveries, depending on the situation:
5) The defense commits the most violations.
Pitchers and catchers account for 71.1% of violations, while batters have been responsible for 28.9%.
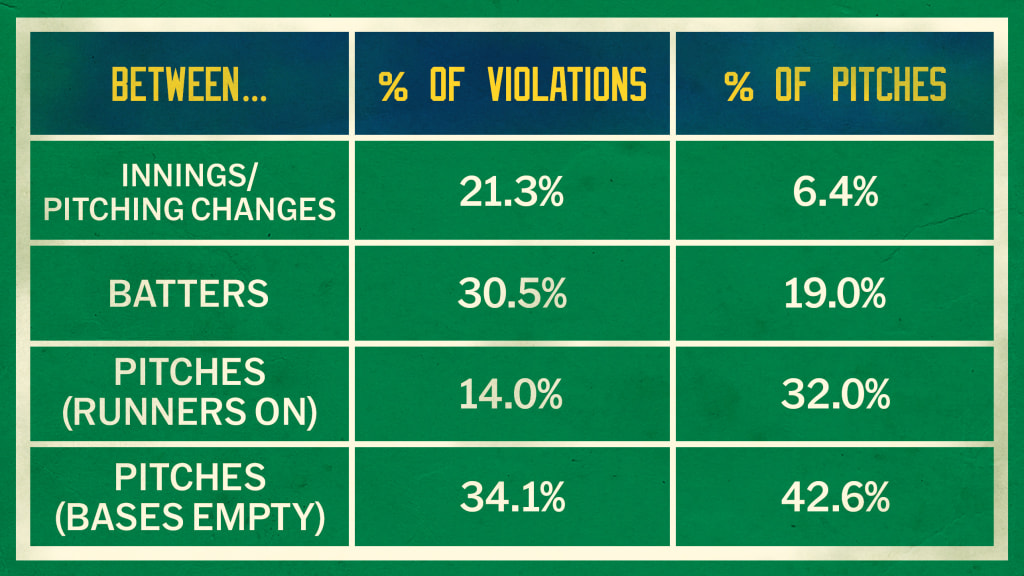
6) Most violations occur between innings and batters.
We’re into some serious timer violation minutiae now, but, for the insatiably curious, here are the percentages of pitch timer violations based on situation:
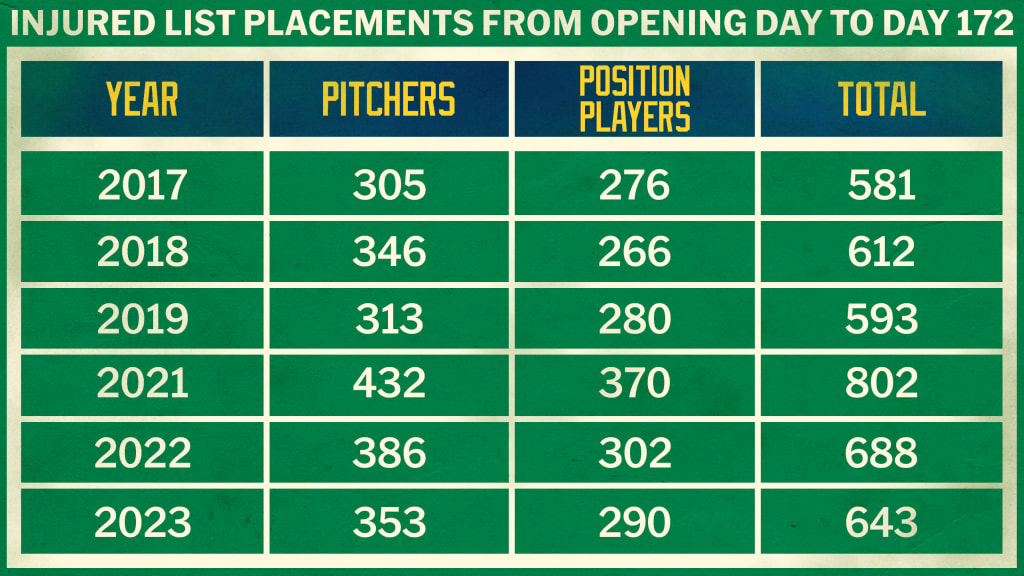
7) There is no evidence the timer caused more injuries.
We went in-depth on this subject midseason, about how injured list data is complicated and how MLB has seen a long-term increase in injured list days (particularly for pitchers) for decades, despite average game times gradually increasing in the years prior to the adoption of the pitch timer.
What we’ve seen this year is a decrease in both pitcher and position player injured list placements when compared to the same number of days last season and numbers that are relatively in line with recent full seasons (aside from the first full season post-COVID, when injuries ramped up dramatically).
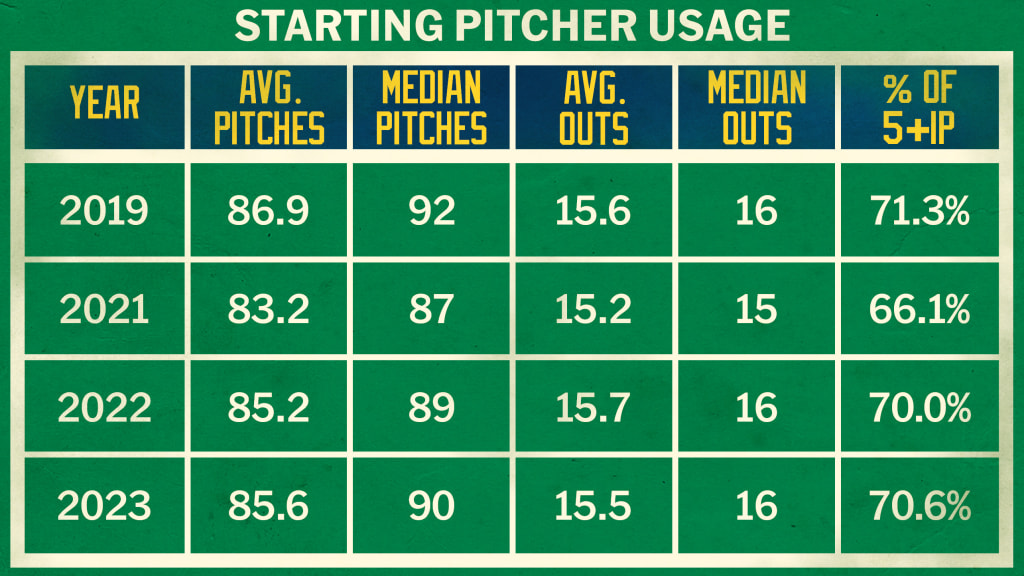
8) The timer hasn’t changed starting pitcher usage.
The increased pace hasn’t led to starters fatiguing any earlier or lasting in games any longer than they once did.
9) Basestealing exploded.
The timer brought us back to the 1980s in terms of game times. The pickoff limits and slightly bigger bases didn’t quite get us to the track meet that existed in that decade, but they definitely increased the aggressiveness on the basepaths, as the electric Ronald Acuña Jr. can attest.
Stolen-base attempts have increased to 1.8 per game in 2023, a leap from 1.4 in 2022 and the highest rate of attempts since 2012 (also 1.8). The 80.4% success rate is not only a jump from 75.4% last year but the highest in MLB history.
The disengagement limit limited pickoff attempts from 6.0 per game to 4.9 per game.
10) But runners do still get picked off.
Perhaps the pickoff limits led some runners to be a bit too ambitious with their leads, because there have been more successful pitcher pickoffs this season (324) than in 2019 (291), 2021 (270) or 2022 (271).
Also, the stolen-base success rate is actually lower after two disengagements (78%) than it is with zero disengagements (80.6%), even though pitchers, predictably, rarely risk the automatic balk with a third pickoff attempt. There are less than 0.1 attempts per game in this situation.
11) More balls in play go for hits.
The goal of having infielders in their natural positions was to obtain more traditional results on balls in play. We’ve seen that. The leaguewide batting average on balls in play (BABIP) has increased from .290 last season to .297 this season.
Predictably, given that extreme shifts were most prominently employed against left-handed batters, most of the improvement has come for lefties, who have seen their overall BABIP improve from .283 to .295 and their BABIP on pulled ground balls and pulled line drives increase by 35 points and 27 points, respectively.
12) Defensive shift infractions are exceedingly rare.
No real surprise here. The defensive shift restrictions requiring two infielders on each side of second base, within the outer boundary of the infield, is not especially difficult to abide by.
In more than 40,000 innings played this season, how many times has a defender committed an infraction, leading to an automatic ball? Only three! If you’ve witnessed one in person, go buy a lottery ticket and avoid lightning.