

When MLB had its usual spate of pitching injuries at the start of the 2023 season, some questioned the impact of the pitch timer. But updated data and historical trends both throw cold water on the theory that the pace created by the timer is to blame for ailing arms.
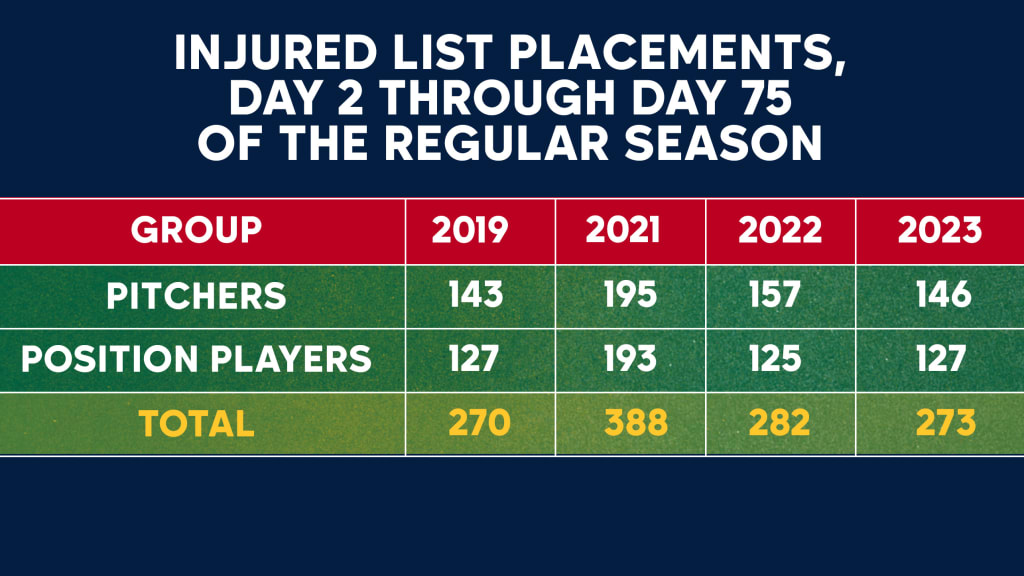
Pitching injured list placements in the first 75 days of the regular season were in line with 2019 and 2022 and down significantly from 2021.
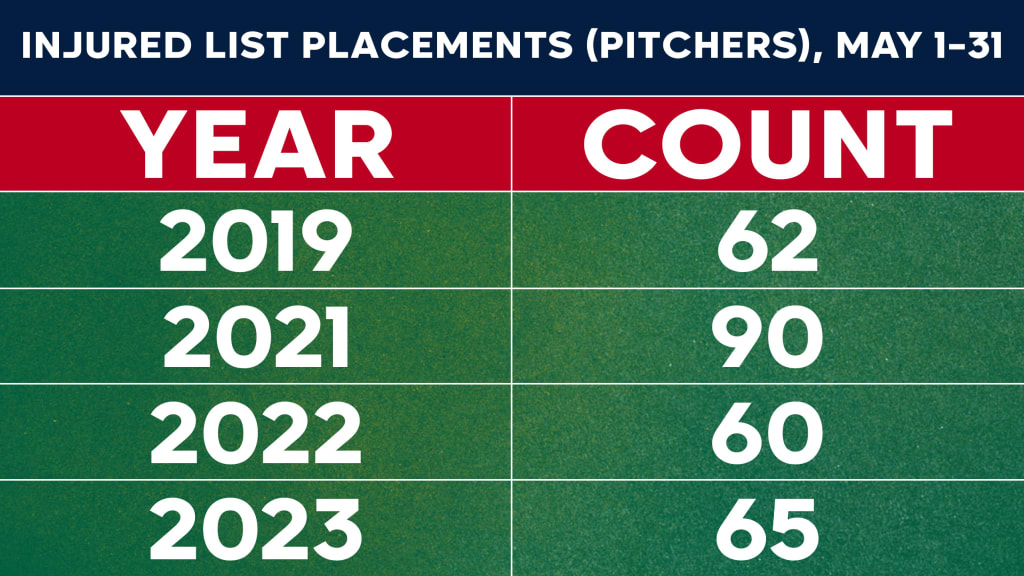
The same goes for pitcher injured list placements in the month of May:
While injured list placements are up year over year going back to the start of Spring Training, that data is inherently skewed by an earlier spring start date when compared to the COVID-impacted 2021 season and the lockout-impacted 2022 season.
“You can’t prove [the pitch timer is to blame for injuries],” said Glenn Fleisig, research director for the American Sports Medicine Institute and injury research advisor for MLB, “because we don’t live in a world in which only one thing changed from last year to this year.”
What has changed from year to year – once again – is the average velocity in MLB. The average four-seam velocity at this point in the season has increased from 93.8 mph in 2022 to 94.0 mph in 2023. The average breaking ball velocity has increased slightly from 82.6 mph to 83.0.
Fleisig said velocity is a much clearer injury culprit than the pitch timer.
“We’ve done studies in the biomechanics lab that have proven what is assumed to be true,” said Fleisig. “If you throw faster, it’s more torque on your elbow.”
Pitcher injury events decreased in the Minors last season -- the first with the pitch timer at every level of MiLB.
Still, the question of whether the timer influences injuries will persist every time an important arm goes down. So let’s look at the data we have and explore why we probably shouldn’t be in a rush to blame them on the timer.
1. Injury data is … complicated.
We’ve cited injured list data in this piece, because, without access to the medical records of every player on every team, that is the best means we have of relaying injury trends.
But injured list data is skewed by the way teams manipulate the injured list.
“[The injured list] is a roster management tool,” said Stan Conte, a longtime MLB athletic trainer and physical therapist who founded Conte Injury Analytics, “not an injury database.”
Teams use the injured list to cycle players -- particularly pitchers and especially relievers -- on and off the active roster. Therefore, it is impossible to know how many of those “injuries” were serious concerns as opposed to phantom or exaggerated excuses used to stash players without losing them to the Minor Leagues or another team.
This manipulation became particularly pronounced when MLB shifted from a 15-day to 10-day injured list in 2017 (the pitcher IL expanded back to 15 days in 2022).
Furthermore, this 2023 season was the first to begin with a 13-pitcher roster limit, which also impacts the way teams utilize the injured list.
That’s a long-winded way of saying: Take injured list data with a necessary grain of salt.
With that said…
2. A longer spring skews the 2023 numbers
The raw injured list numbers as of this writing show an uptick in injuries for both pitchers and position players in 2023 (the 2020 data from the pandemic-altered year is not included in the below charts).
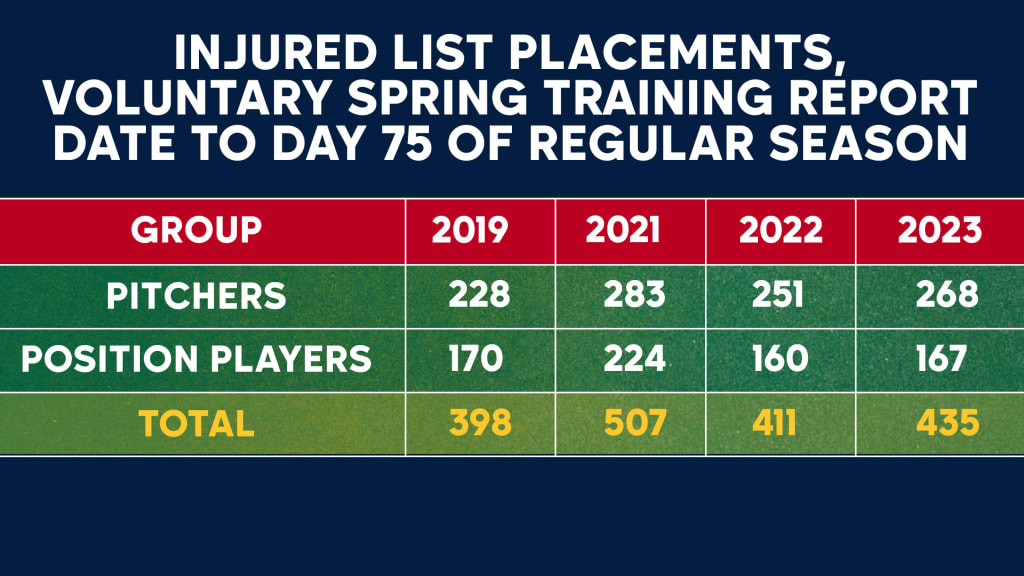
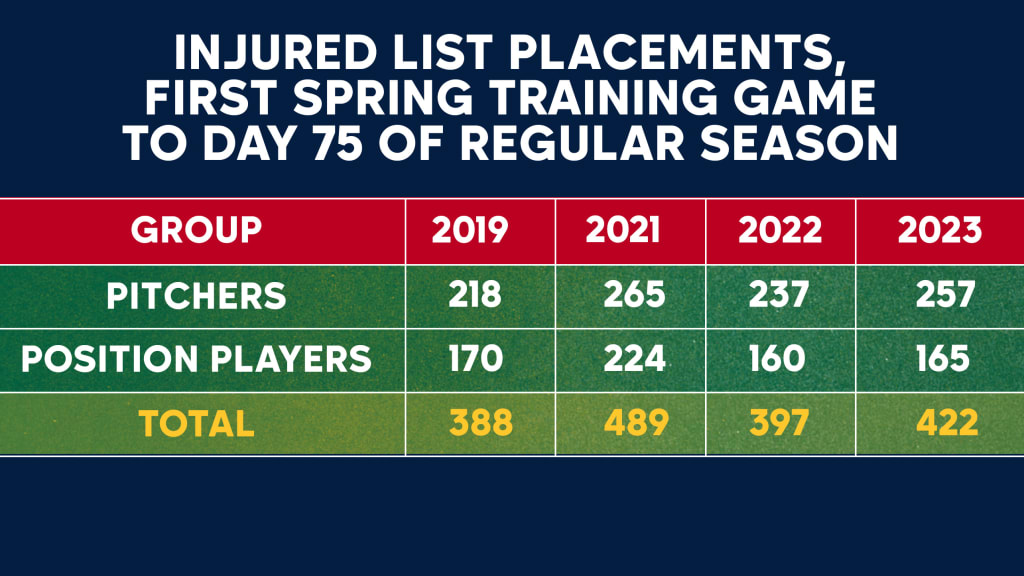
In both cases, you can see that pitching injuries have increased when compared to 2022. But because of last year’s lockout, the 2022 voluntary report date was 26 days prior to Opening Day and there were only 21 days of Spring Training exhibition games. This year, with a full spring on tap and the World Baseball Classic taking place, the earliest voluntary report date was 45 days prior to Opening Day, and there were 33 days of exhibition games.
A broader comparison to the last “normal” MLB season back in 2019 shows an increase in pitcher injuries. Again, though, the pitch timer is hardly the only thing that has changed in that amount of time.
“With the pandemic, the Major League season was shortened in 2020 and there was no Minor League season,” Fleisig said. “I think the data shows the trends are still recovering from this break in normal play.”
There’s really no telling how much the schedule has contributed to injuries. But we do know this…
3. Most of the injured players have been hurt before.
Medical experts say the best predictor of future injury is past injury. And that’s definitely been the case this year.
More than 66% of the players who have been placed on the injured list in 2023 missed seven or more days in 2021 or 2022, when, of course, there was no pitch timer at the MLB level.
“There are two reasons why a player with a past injury has a higher chance of getting hurt,” Fleisig said. “The past injury might still be lingering. He’s not 100% healthy. The other reason is, whatever factors or behaviors that led to the first injury, he’s doing the same thing. He’s pitching with too little rest or poor mechanics or bad strength and conditioning.”
So last year’s injuries contribute to this year’s injuries, which contribute to next year’s injuries.
And let’s not forget…
4. The MLB injury rate has been rising for decades.
If we are to subscribe to the theory that a sped-up pace is contributing to a rise in injured list placements, then how do we explain the trend in which injured list placements increased, even as the game slowed down?
Take a look at the average injured list days by position group and time period since 2005, along with average time of game:
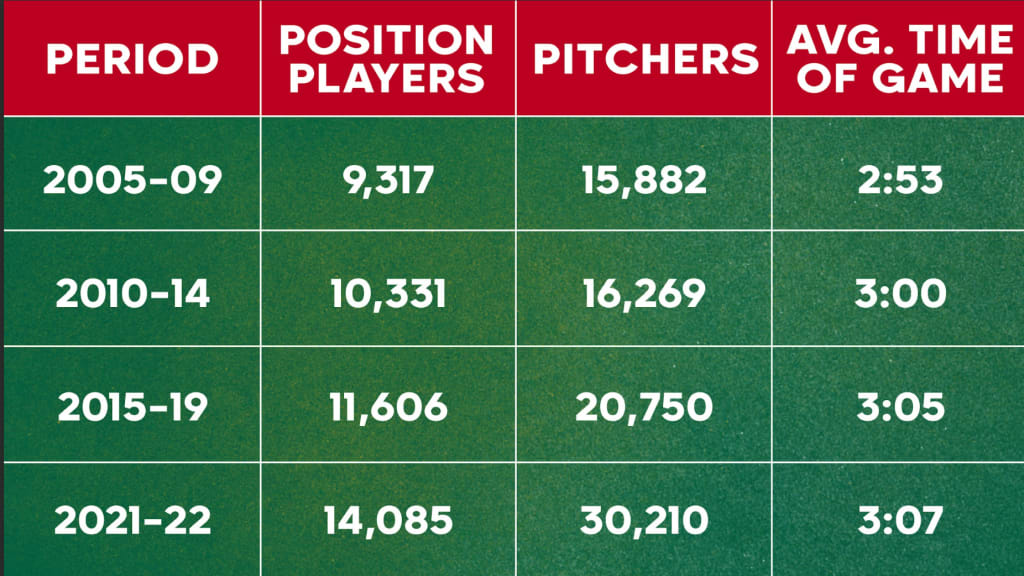
Prior to the pitch timer, players had all the time in the world to gather themselves, take a breath and recover from a sudden burst of athletic activity.
They got hurt, anyway.
Conte has been tracking the financial ramifications of these injuries -- the amount of money teams are paying to players on the injured list plus the cost of replacing them with another player -- for decades. He noted a milestone in 2022.
“Last year was the first time we broke $1 billion in losses,” Conte said. “The numbers just keep going up.”
That’s true in the big leagues and in the Minor Leagues, where, Conte notes, the number of Tommy John surgeries performed went from 68 in 2010 to 210 in 2021.
This, combined with the increased prevalence of Tommy John recipients at the amateur level getting drafted into the pros, creates a culture in which more and more pitchers arrive to the big leagues having previously been hurt.
As you can see, the increase in injured list stints over the past 30-plus years has been especially pronounced with pitchers. You know what else has seen a pronounced increase for pitchers in that time period?
That’s right. Velocity. We know there is a correlation between increased velocity and increased injury risk. And from what we’ve seen in 2023…
5. There is no clear correlation between increased pace and injury.
For this point, we’ll refer you to this piece by Dan Szymborski of FanGraphs that researched the pitchers whose pace between pitches was most and least affected by the new rules. Szymborski’s research found that, of the 447 pitchers who pitched at least five innings in both 2022 and 2023, 123 – or 27.5% -- have appeared on the injured list. Of the 50 pitchers with the largest changes of pace, nine (18.0%) have been on the IL, while eight (16.0%) of the pitchers with the smallest changes have been on the shelf. Of the 50 pitchers who sped up the most, only one – reliever Chris Martin – has landed on the IL this season.
In other words, there was no meaningful relationship between increased pace and increased injury.
“The bottom line, in my opinion, is there may be an adjustment period that we’ve undergone here, but I don’t believe that pitching injury rates will be higher with the pitch timer than previously,” Fleisig said. “Because I think the pitchers have enough time to recover. The 15 or 20 seconds between pitches, I don’t think it’s adding extra stress. The injuries happen by having bad mechanics and high effort and the accumulation of all the pitches during that game. I don’t think the amount of time makes a big difference, versus how much you’ve thrown.”