

Luis Robert turned hype into performance as a rookie in 2020. Now, the 23-year-old White Sox center fielder faces rising expectations as a popular breakout pick.
But there’s reason to be bullish on Robert beyond his youth, his loud tools, and his knack for making memorable plays, such as last October’s 487-foot blast in Oakland during the postseason. And it has to do specifically with the quality of his contact at the plate.
Now, we first must acknowledge the fact that Robert needs to make more contact in the first place. Few players last year swung more often, and Robert’s hacks often came on pitches outside the zone. His whiff rate on swings ranked in the second percentile among MLB hitters, and strikeouts were plentiful, which hurt Robert during a second-half slump.
The tendency to hack and miss was apparent to anyone watching Robert as a rookie, but what might come as a surprise -- given mammoth big flies such as the one noted above -- is that Robert’s average exit velocity and hard-hit rate didn't stand out.
Among 142 hitters who qualified for last season’s Statcast leaderboards, Robert ranked:
• Tied for 73rd with a 39.8% hard-hit rate
• Tied for 98th with an 87.9 mph average exit velocity
His exit velocity was on par with the likes of Nick Ahmed and Jean Segura, plus some bigger names who battled injuries and/or slumped in 2020 (Nolan Arenado, Robert's teammate Yoán Moncada). Not what you might expect for a sculpted, 6-foot-2, 220-pound slugger who has shown he can obliterate a baseball.
So what’s going on here?
The batted balls that matter
Is a 20-mph gap in exit velocity between two batted balls meaningful? Well, it depends.
2020 MLB-wide BA/SLG on batted balls
105-106 mph exit velo: .654/1.465
85-86 mph exit velo: .222/.259
65-66 mph exit velo: .231/.243
The 20-mph gap between 85 and 105 mph is enormous, as outcomes don’t begin improving significantly until about the 95-mph mark. (That’s why 95 mph is the cutoff for a hard-hit ball). But there is virtually no difference between 85 and 65 mph. The extra 20 mph there doesn’t improve the outcome, and it doesn’t suggest better production in the future.
Meanwhile, this breakdown of Robert’s 2020 batted balls helps illustrate why this affects him so much.
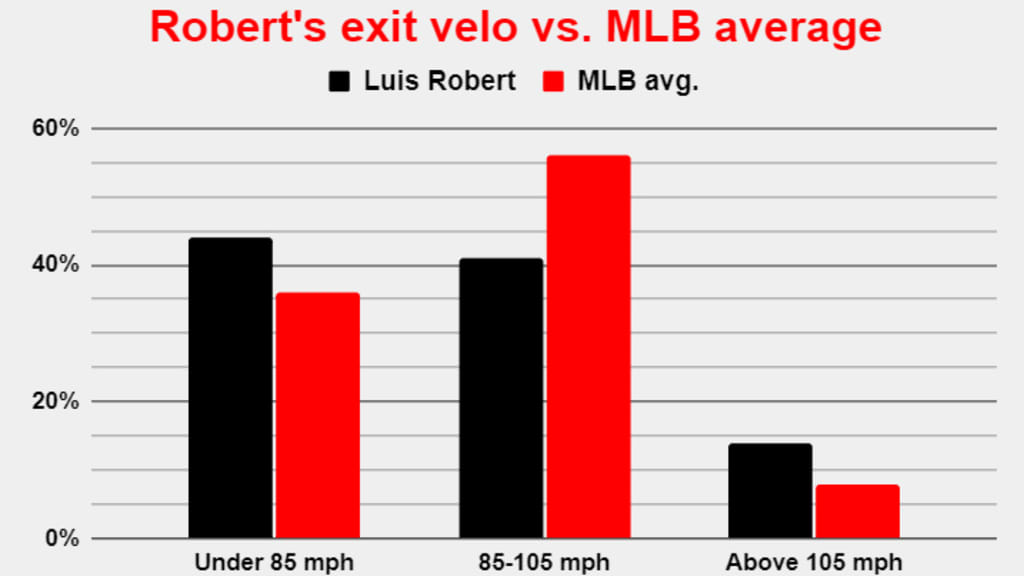
Robert made a lot of elite contact, but he also made a lot of contact that fell in the range where the exact number is basically inconsequential. And those balls dragged down his average. So what’s the solution?
Focus on the top half
This Twitter thread from MLB.com senior data architect Tom Tango helps explain the situation.
The metric “wOBAcon” (wOBA on contact) might look like a confusing jumble of letters, but to put it simply, it’s measuring the effectiveness of a hitter when he puts the ball in play -- giving appropriate credit for extra bases, including homers. Marcell Ozuna led MLB last year at .548, while Robert was at .430, a bit below what was expected (.446) based on his quality of contact.
Tango’s calculations show that if you want to make a hitter’s average exit velocity as meaningful as possible, then using only the top half of that hitter’s batted balls is the way to go. After that, the value declines all the way to until you get to full sample.
Factoring in the postseason, Robert’s total average exit velocity was 87.3 mph, below the MLB average of 88.0. But, if you rank all of his batted balls by exit velo, separate the top half and take the average of that group, you get 101.1 mph. We’ll call this the “Top-half exit velo,” and the MLB average is 99.0 mph. So Robert goes from below average to well above.
Let’s take it one step further. Tango examined nearly 1,800 batter seasons going back to 2016 and ranked them by the difference between the top-half exit velo and actual exit velo (while including postseason numbers). In other words, how much did the hitter gain by focusing on only his hardest-hit balls?
Largest gaps between top-half and total exit velo
- Roberto Pérez (CLE), 2017: +14.9 mph
- Giancarlo Stanton (MIA), 2017: +14.0 mph
- Luis Robert (CHW), 2020: +13.7 mph
- Starling Marte (PIT), 2017: +13.6 mph
- Maikel Franco (KC), 2020: +13.5 mph
Robert is way up there, even if his top-half exit velo still isn’t at the very top of the scale, on par with 2020 leaders Miguel Sanó (107.0 mph), Fernando Tatis Jr. (105.4 mph), Ronald Acuña Jr. (104.9 mph), Teoscar Hernández (104.7 mph) and teammate José Abreu (104.3 mph).
Still, the difference is stark if you look at how he compares with his peers in this light, instead of in total exit velo or even hard-hit rate, which lumps all balls hit below 95 mph together but does the same for those above that line. (That hurts Robert, whose six homers on balls hit 110-plus mph ranked behind only Hernández and Pete Alonso).
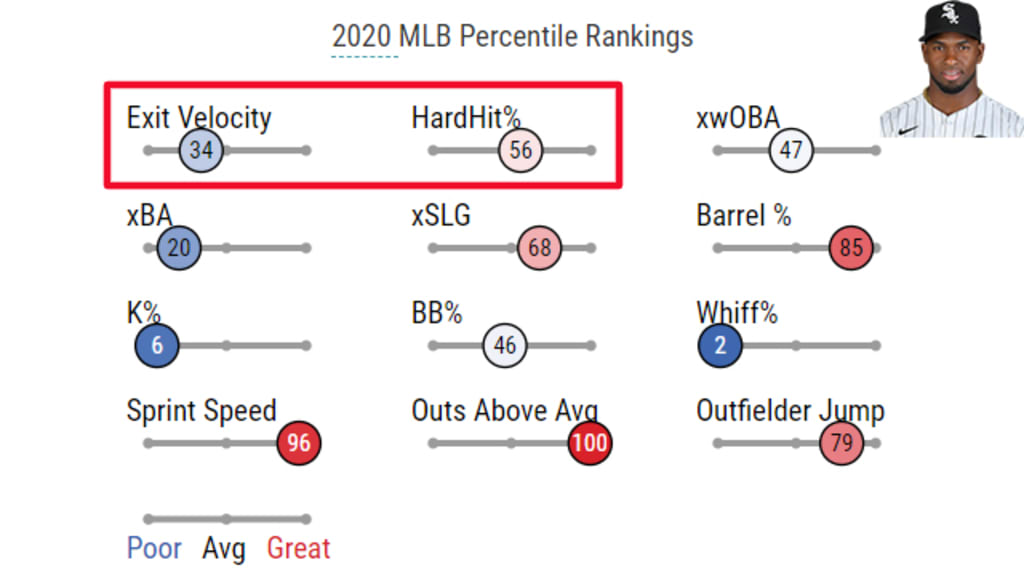
Robert’s 2020 percentile ranks
Total exit velo: 34th percentile among MLB hitters
Hard-hit rate: 56th percentile
Top-half exit velo: 73rd percentile
That’s better, and more in line with Robert’s 84th-percentile barrel rate, which also takes into account his ability to drive the ball in the air.
Looking ahead
As previously noted, Tango’s research shows that when it comes to exit velocity, the best way to project future performance on batted balls is to consider that top-half figure instead of the total figure.
Fortunately, at least some projection systems already do that. One of those is Steamer, which is available at FanGraphs and features a model that incorporates this finding. So while Robert’s Steamer projection shows him with a .473 slugging percentage in 2021 (up from .436 in ‘20), that number would have dropped all the way to .450 had the system only considered Robert’s total exit velo, according to developer Jared Cross.
Of course, anyone who has seen Robert square up a baseball knows that his ceiling is well above that. Now it’s a matter of getting there.