

Some strange, lopsided batting lines appear in the early going every season. This season is no exception, but even in that context, Max Muncy's is a doozy.
Just take a look at what the Dodgers infielder was slashing through his first 33 games of 2022: .163/.341/.298. That’s obviously not good, although it’s also not nearly as bad as you might expect.
Weighted Runs Created Plus (wRC+), an offensive metric similar to OPS+ that adjusts for the offensive environment and park effects, has Muncy at a 97 -- just three points under the MLB average. Of course, that’s still way below what Muncy produced in his three full seasons since joining the Dodgers: 162 (2018), 133 (‘20) and 140 (‘21).
But the main point here isn’t the quality of Muncy’s slash line. It’s the oddity.
Muncy base hits through 33 games: 17
Muncy walks through 33 games: 27
Throw in one hit-by-pitch, and Muncy had reached base safely via free pass twice as often as he had done it via a batted ball, before picking up three soft singles over his past two games, including one via a bunt on Monday night. Even in an era of low batting averages and high walk and hit-batter rates, that stands out.
Highest hit-to-walk ratio in Modern AL/NL history
In a qualifying season (since 1900)
- Barry Bonds, 2004 SFG: 1.72 (232 BB, 135 H)
- Max Muncy, 2022 LAD: 1.59 (27 BB, 17 H)
- Jimmy Sheckard, 1913 CIN/STL: 1.39 (68 BB, 49 H)
- Jim Wynn, 1976 ATL: 1.37 (127 BB, 93 H)
- Barry Bonds, 2002 SF: 1.33 (198 BB, 149 H)
As usual, peak Bonds belongs in an entirely separate category. (His two seasons noted above rank first and second all-time for both total walks and intentional walks). Set him aside, and Joey Gallo’s 1.12 ratio last year (111 walks, 99 hits) was the highest in a non-shortened qualifying season since Wynn’s 1976.
Of course, it’s important to note the “qualifying season” caveat. White Sox catcher Yasmani Grandal had 1.3 times as many walks (87) as hits (67) a year ago, but that was in only 375 plate appearances, thanks in part to nearly two months spent on the injured list.
The leaderboard above is also not an apples-to-apples comparison. The Dodgers have played roughly one-fifth of their schedule, and Muncy’s ratio almost certainly won’t remain such an outlier all the way through September. But even focusing on the start to a season, this is rare territory.
27+ walks AND 17 or fewer hits
Through a player's first 33 games in a season (since 1901)
2022 - Max Muncy (LAD): 27 BB, 17 H
2021 - Yasmani Grandal (CHW): 38 BB, 12 H
2000 - John Jaha (OAK): 33 BB, 17 H
1987 - John Cangelosi (PIT): 28 BB, 10 H
1973 - Denis Menke (CIN): 27 BB, 17 H
1961 - Eddie Yost (LAA): 30 BB, 16 H
1937 - Woody English (BRO): 28 BB, 16 H
1935 - Sammy Holbrook (WSH): 27 BB, 16 H
Jaha's 33rd game was his last of the 2000 season. Of the other six, only Menke collected more walks than hits over the rest of that season, which shows that such extreme results usually regress toward the mean as the sample size expands.
Still, considering Muncy’s importance to a stacked Dodgers lineup, it’s worth looking into how he got to this point and what it means moving forward. (All stats below are through Sunday's games).
The walks are nothing new
This part of the equation is actually fairly normal. Muncy was a patient hitter before he ever got to the Dodgers, and he certainly has been one since his breakout 2018 campaign in Los Angeles.
Over the past four seasons, only seven qualified hitters topped Muncy’s 15.2% walk rate, and that served him well. He ranked in the top 20 in MLB in OBP (.371) and wRC+ (138) during that stretch.
Muncy remains one of the most patient hitters in the game, ranking in the 97th percentile in chase rate, his fifth straight season in the 94th percentile or higher. And he’s especially stingy in terms of going after offerings in what Statcast considers the “chase” and “waste” areas -- further than one baseball’s width outside the edge of the zone. Of more than 230 batters who have seen at least 100 such pitches, only teammate Will Smith has swung at a lower rate than Muncy (6.2%).
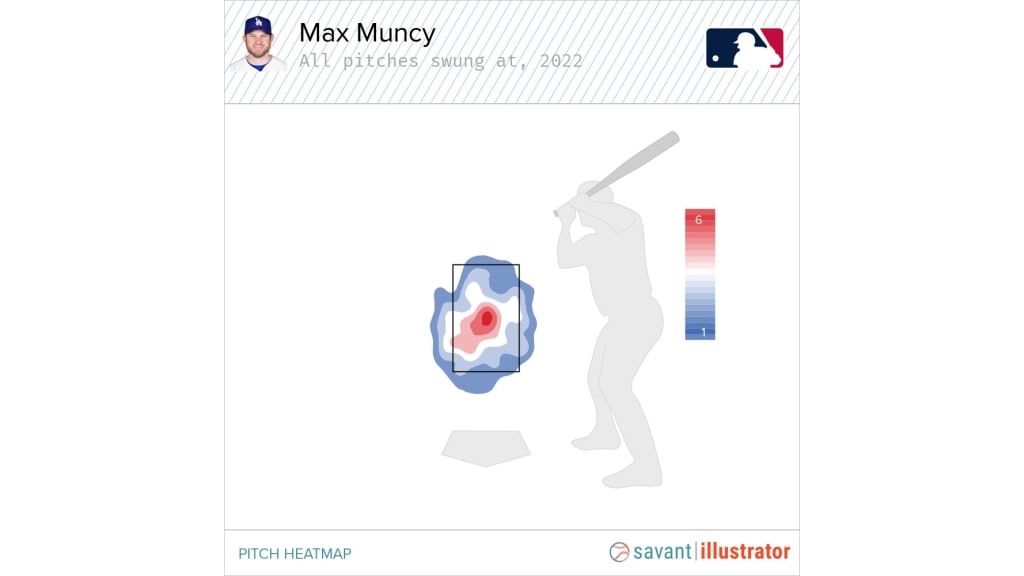
What is perhaps concerning is that Muncy -- never especially aggressive in the zone, either -- has become increasingly passive there as well. His 55.4% swing rate against pitches in the “heart” of the zone (at least one baseball’s width inside the edge) is also MLB’s second lowest. That might lead to deeper counts and eventually more walks, but also passes up the sorts of pitches most likely to become base hits. Only Grandal has taken more called strikes on those heart-of-the-zone offerings while ahead in the count than Muncy.
Where have all the hits gone?
It would be more comforting for the Dodgers if this were simply a case of bad luck. But while Muncy’s expected batting average based on quality of contact is 52 points higher than his actual average, that hardly stands out from the pack.
The culprit? Muncy simply is not driving the ball the way he usually does. Remember, the lefty slugger is coming back from a torn UCL in his left elbow that he sustained in the final regular-season game of 2021. Whether that has contributed to Muncy being a bit off is difficult to say, but these comparisons certainly stand out:
2021: 46.6% hard-hit rate | 34.9% sweet-spot rate
2022: 36.6% hard-hit rate | 26.8% sweet-spot rate
Those stats refer to how often Muncy hits the ball 95 mph or harder and how often he makes contact in the optimal launch angle range for producing good results. In particular, Muncy is getting under a lot of balls, lifting them above the sweet-spot range (33 degrees of launch angle or higher). He is 2-for-26 (.077) on that variety of contact, which is roughly the league-average success rate.
If Muncy can lock in the swing he unfurled through much of 2021, better results should follow. In the meantime, his trademark patience will at least keep him on base -- and keep him sharing space with Bonds atop an odd leaderboard.