

MLB and the MLBPA held their first bargaining session on May 12 as both parties began working toward the next labor agreement. The CBA expires on Dec. 1.
Competitive balance will be a focus during discussions, if not the primary issue.
Here’s what you need to know about the state of competitive balance in the game:
Q: What’s the right way to define competitive balance?
In my view, optimal competitive balance is about creating equal opportunity. It's about leveling the economic playing surface, so outcomes can be attributed to skill and execution -- not the size of a team’s home market.
Competitive balance does not mean guaranteeing equal outcomes. Clubs with superior scouting, player development and decision-making will have an advantage. And they should.
We want competition to bring out the best in clubs and players.
Merit-based dynasties occur in cap-and-floor sports. The Super Bowl wins accumulated by the Kansas City Chiefs in recent years were driven by merit and execution, not local revenue advantages. The issues plaguing the Cleveland Browns are not tied to resource disadvantages.
The big difference is a team of any market size has an equal opportunity to compete in the NFL, NBA and NHL. The same is not true in baseball.
There are still those who argue parity is not even an issue -- when it’s perhaps the central issue.
Q: Does MLB have a competitive balance problem?
Yes. The divide is real and it's tied to a growing imbalance of financial resources.
This opportunity gap -- both real and perceived -- creates a drag on a sport that otherwise enjoys considerable momentum from popular rules changes like the pitch clock, and ABS challenge system, to an incredible wealth of talent on the field. Too many fanbases enter the season with little hope of contention.
While there are outlier cases like the Phillies and Mets early this season, struggling as high-payroll clubs, over the last decade these advantages have been real for large-market clubs.
There is also the perception of inequity. If fans believe the game is unfair, they are less likely to spend their hard-earned discretionary income on tickets. They are less likely to invest time and emotions in the sport. A wide resource spread also means there are far fewer headlines generated in the offseason in smaller-markets, further dampening enthusiasm.
Q: But haven’t we seen different World Series winners lately?
Yes, there have been seven different World Series champions over the last decade. But each of the last 10 champions were large-market clubs, defined as teams from the 15 largest media markets. The last small-market MLB team to win a World Series was the 2015 Royals.
A variety of large-market champions does not constitute competitive balance, either, though they are often conflated.
The NFL, NHL, and NBA combined to produce 15 small-market champions over the last decade.
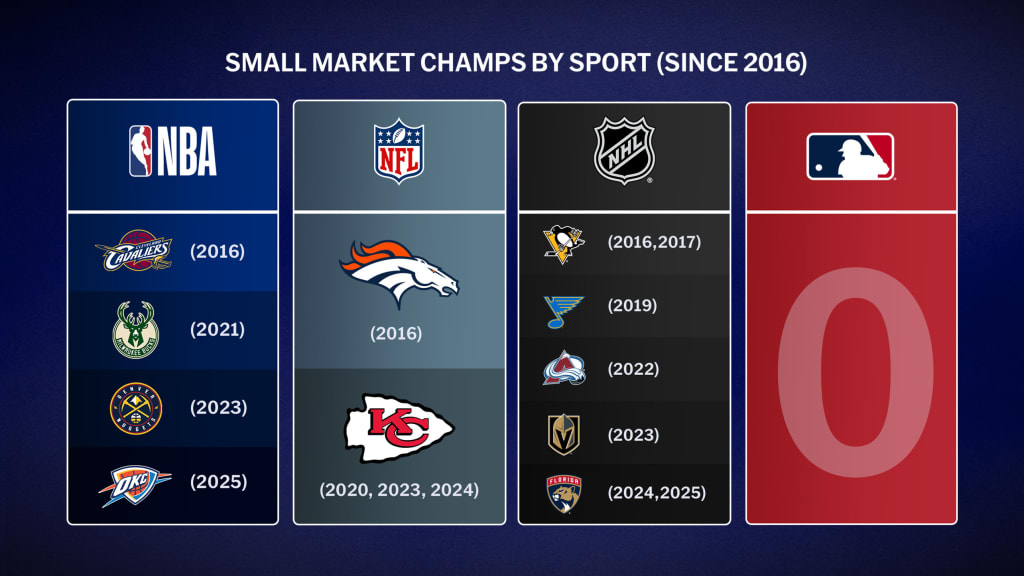
In the NFL, 24 of the last 30 Super Bowl champs hailed from small- or medium-markets (i.e. outside of the top 10).
Q: How do small-market teams perform in the playoffs?
Since 2015 (excluding the COVID-shortened season), 37% of the teams that made the playoffs came from bottom-half markets. And once they qualify, they generally have not gone far. Over that time, top-half market teams reached the World Series at a rate of six times greater than bottom-half teams (17 teams versus three) and won it nine times more. A top-half team reached an LCS series three times more often than bottom-half teams (31 to nine).
The edge is significant.
Q: What about regular-season performance?
The regular season offers a larger sample less prone to small-sample variance. MLB is the only major North American pro sport in which the top-five markets significantly out-perform the bottom-five. In the NFL, NBA and NHL the bottom-five markets actually outperform the top-five. The delta in winning percentages since 2015:
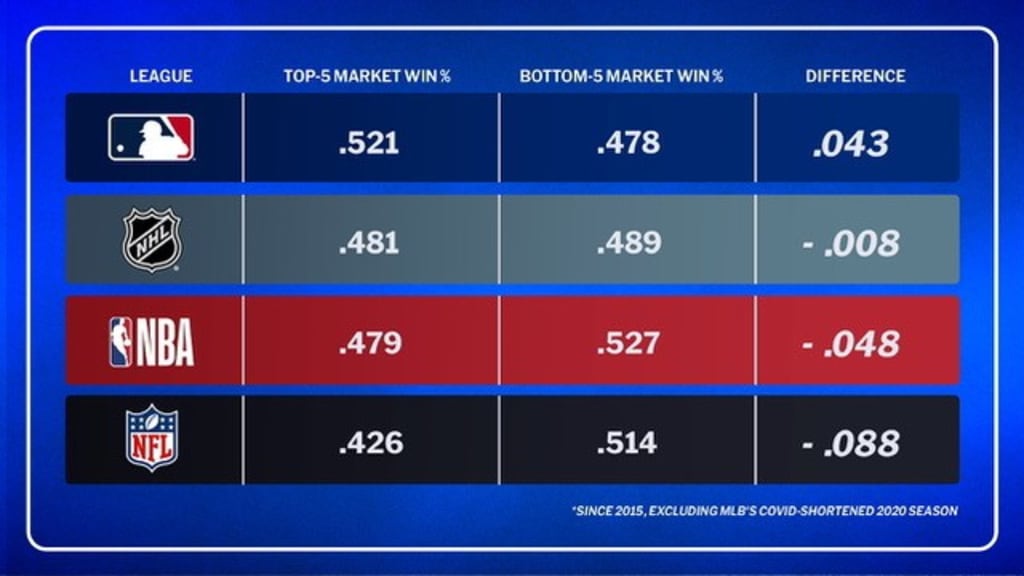
Moreover, from 1998-2025 (since MLB went to 30 teams), top-five payroll MLB teams averaged 89 wins per season whereas bottom-five payroll teams averaged 74.
Geography and market size matter a great deal in MLB.
Q: What do preseason championship odds tell us?
Eleven teams enter this season with less than a 1% chance of winning the World Series, according to FanGraphs.com’s end-of-spring playoff projections. The majority -- nine of them -- resided in medium-to-small markets. Such chances don't create much hope or enthusiasm.
NFL and NBA teams also begin seasons with low title odds, too, but that’s often because they lack a star quarterback or superstar talent -- not because of where they reside.
Consider preseason the number of small- and mid-market teams in FanDuel's top 10 of preseason championship odds:
MLB (2026): 2
NFL (2025): 6
NBA (2025-26): 5
NHL (2025-26): 6
Q: Do fans actually want changes to fix this?
Yes, and by a strong majority. A Morning Consult poll published in November found 79% of "avid" MLB fans and 69% of casual fans supported a cap-and-floor system in MLB.
Avid fans overwhelmingly believed it would improve competitive balance, with 69% saying it would help "a lot" or "somewhat."
A non-scientific reader poll at MLBTradeRumors.com last year showed 67% in favor of a cap.
The game -- and growing the game -- is ultimately about the fans. Fans want competition played within the same constraints. They want outcomes shaped by skill and execution -- not resource advantages. This columnist is not aware of any NFL fan demanding a system in which top stars sign with the largest-market teams after rookie contracts. Who would want to sit down at a Las Vegas poker table and have a talented opponent be dealt an extra card?
Q: Is the competitive imbalance getting worse?
The gulf is growing. The divide in payrolls is historically wide. In 2025, the payroll gap was $446 million, or a factor of seven, from top to bottom. (The No. 1 total payroll spend was the Dodgers at $515 million when including Competitive Balance Tax payments, No. 30 was the Marlins at $69 million.)
One big factor is the disruption to the cable model, which disproportionately affects small- and mid-market teams. Affected clubs that lost RSN deals have had their local media revenues reduced by about half.
Twins ownership recently shared that the club sold 50,000 streaming subscriptions last year at $99 per sub -- about $5 million -- while trying to replace revenues from a defunct cable deal that paid $54 million in 2023. Their combined cable-and-streaming revenues still fall far short.
By contrast, the Dodgers enjoy $334 million a year from their regional cable TV deal. (Their 2012 bankruptcy deal also shields them from a full revenue-sharing allotment.)
Spending isn’t the only factor in their success, of course, but free-agent signings account for $267 million, or 65% of the Dodgers’ current 2026 tax payroll, per Spotrac. Last season, about half their fWAR (47%) came from free agents; add in nine-figure extensions for traded players and that share rises to 56%.
From 1998-25, the Dodgers ranked No. 2 in total payroll ($5.17 billion) and second in winning percentage (.560). The Yankees ranked No. 1 in payroll ($6 billion) and first in winning percentage (.586).
Said Guardians GM Mike Chernoff during the offseason: "We can’t [as a small-market team] sign top-tier free agents. It’s just impossible with the economic landscape in baseball."
Q: Can’t owners just spend more?
There’s no doubt some teams would benefit from greater spending. Ownership groups generally spend a similar share of revenue on payroll, and profit margins -- at least as judged by the Atlanta Braves’ public financials -- are not as robust as many assume. If every owner spent like the Mets, most teams' balance sheets would be deep in the red. Teams are sensitive to local revenue flows. Even if small-market clubs spent all their revenue on MLB player payroll they would still fall far short of the Dodgers' payroll given their enormous local resource advantage.
Perceived unfairness and lack of spending then shapes reality. Fans become more reluctant to invest emotions, time and hard-earned income. Low playoff odds and quiet offseasons dampen interest. More teams need to be involved year-round to generate sustained interest.
Q: Does competitive balance actually matter for the league’s growth?
It’s difficult to directly quantify, but consider the compound annual growth rates (CAGR) of revenue for the major North American sports since 2015: NBA 10.7%, NFL 7.5%, NHL 6.8%, MLB 2.7%.
Sports with greater competitive balance and the perception of equal opportunity have enjoyed stronger revenue growth. If MLB had matched the NBA’s growth, it would have doubled league revenues.
All of this economic discussion is a gray cloud that looms over major positive developments.
The pitch clock and other rules changes have been widely popular and helped reverse 20 years of attendance declines with three consecutive years of gains. New TV deals are in place. There’s an incredible wealth of talent on the field. We just witnessed an amazing postseason and World Baseball Classic. But the imbalance remains a drag. MLB cannot reach its full potential until opportunity is more widespread.
In baseball, destiny is too often tied to geography.
Note: The majority of this analysis did not include the COVID-shortened 2020 season.