

Hitting is hard enough on its own. There's the classic baseball wisdom that even the best hitters fail 70 percent of the time. And hitting now is harder than ever, because pitchers now are nastier than ever.
So to have bad luck on top of all that? Ouch. But it happens. And these hitters have been the unluckiest this season.
There's more than one way of exploring "luck" by the numbers. Here are a few big ones, and the unfortunate players who stand out in 2019. (Stat leaderboards are entering the weekend.)
Outs on hard contact.
Step 1 is hit the ball hard. If you hit it hard, good things are supposed to happen. But sometimes they don't.
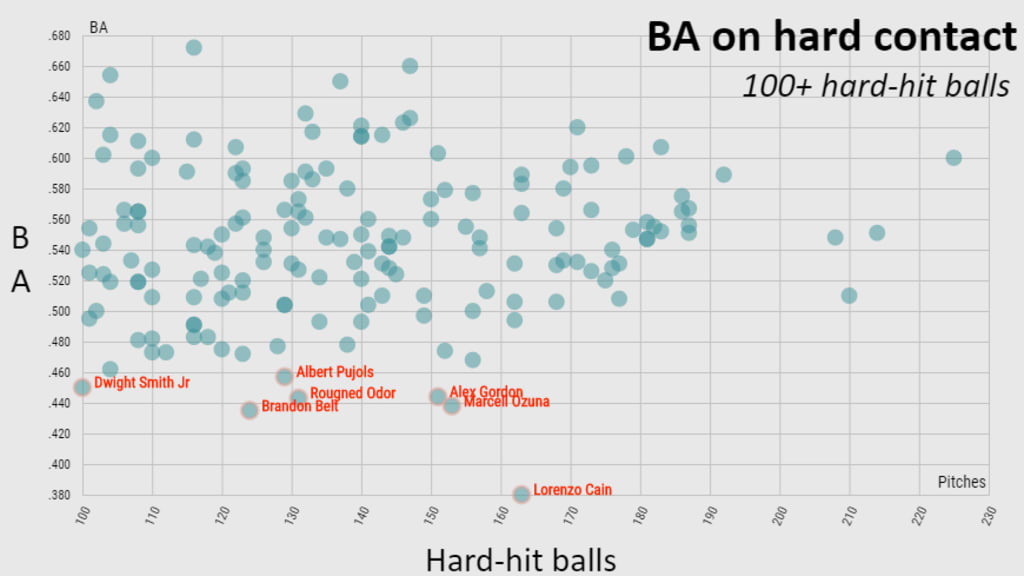
Statcast defines a hard-hit ball as 95 mph or greater off the bat. When MLB hitters reach that exit velocity threshold, they bat .541. A hard-hit ball is a hit more than half the time. Well, not for these guys.
Highest % of outs on hard contact in 2019
Of 168 hitters with 100+ hard-hit balls
- Lorenzo Cain (MIL): 61.0%
- Brandon Belt (SF): 57.5%
- Alex Gordon (KC): 56.1%
- Rougned Odor (TEX): 55.0%
- Marcell Ozuna (STL): 54.8%
Cain has battled through thumb and knee injuries this year, and his production has suffered. His batting average has dropped by over 50 points, from .308 to .252. But he's also hit into a ton of hard outs.
Over 100 of Cain's hard-hit balls in 2019 have turned into outs. The only player with more hard-hit outs is Mookie Betts, but Betts has a lot more hard-hit balls overall (217 to Cain's 165), ranking near the top of the MLB leaderboard. Cain's batting average on hard contact has dropped from .530 in 2018 to an insanely low .378 in '19. He'd never even been below .500 until this year.
And see Odor on the list? He entered the weekend below the Mendoza Line, batting .197 over more than 450 at-bats. But 72 of his 131 hard-hit balls had gone for outs.
Think about this: If Cain had exactly Major League average results on his hard-hit balls, he'd have 25 more hits this season. He'd be batting .302. (It's not quite that simple, but it's just a thought experiment.) Odor would get 13 extra hits to take his batting average up to … .226. Hey, it's a start.
Outs on the best contact.
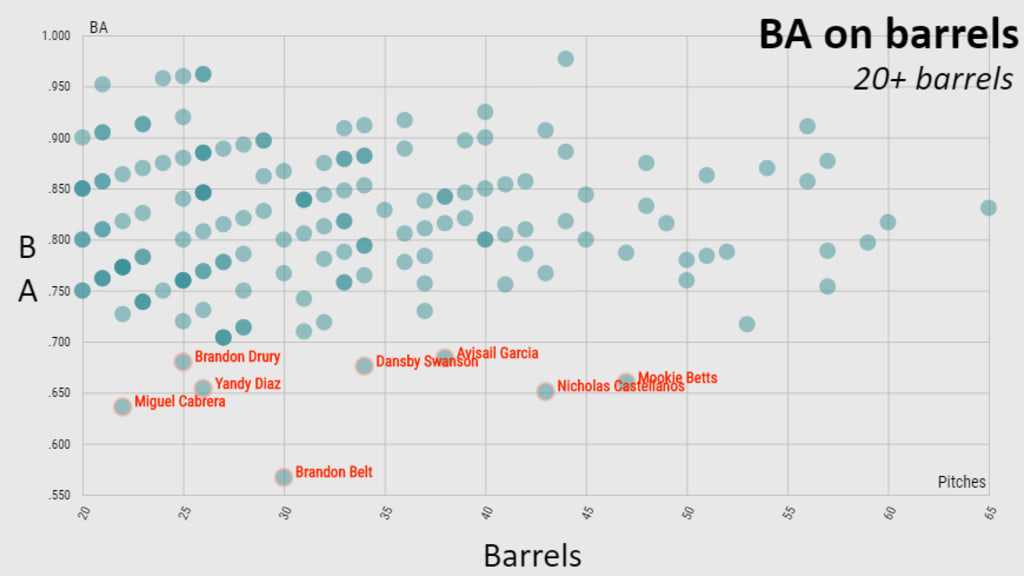
What's better than hitting the ball hard? Hitting the ball hard and in the air. Statcast classifies that most dangerous contact as "Barrels" -- batted balls with ideal exit velocity and ideal launch angle. This season, on barreled balls, MLB hitters are batting .814 and slugging 2.820.
Barrels are supposed to be home runs and extra-base hits. Not outs. Again … not for these guys.
Highest % of outs on barreled balls in 2019
Of 170 hitters with 20+ barrels
- Brandon Belt (SF): 45.2%
- Miguel Cabrera (DET): 38.1%
- Nicholas Castellanos (DET / CHC): 37.2%
- Mookie Betts (BOS): 35.4%
5-T) Brandon Drury (TOR): 34.6%
5-T) Yandy Diaz (TB): 34.6%
See a theme here? Ballparks. The first three hitters all play (or played) in cavernous home parks -- Belt at Oracle Park, Cabrera and pre-trade Castellanos at Comerica Park (and Wrigley Field can keep a ball in the yard, too, on a windy day).
For Belt, this is the first season of his career with a slugging percentage under .400 and an OPS+ below league average. For Miggy, Comerica's vast center field has always been a roadblock, with his center-oppo power profile. For Castellanos -- who made more outs on barrels than anyone in the 4 1/2 seasons of Statcast tracking before he was traded -- escaping Comerica coincided with an immediate home run binge with the Cubs.
Take note of Betts, too, who's put up All-Star but not-quite-MVP numbers this season. Only 17 of his 48 barrels this season have been home runs (35.4%), and only 29 have been extra-base hits (60.4%). In his MVP 2018, 28 of his 61 barrels were homers (45.9%) and 46 were extra-base hits (75.4%). With better barrel luck, maybe he's in the MVP conversation again.
Gaps between expected and actual stats.
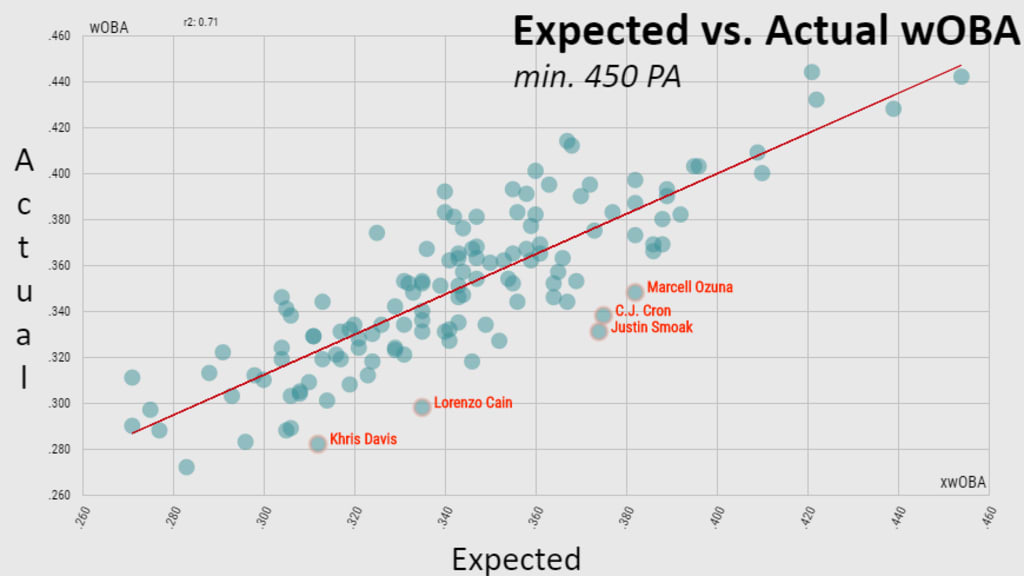
Statcast's Expected Statistics take hitters' quality of contact -- using the exit velocity and launch angle of every batted ball -- and generate an expected batting average, expected slugging percentage and the all-encompassing expected wOBA.
We'll focus on xwOBA here because it's a metric for overall performance, wrapping contact and power and on-base skills into one. Here are the hitters with the largest "unlucky" gaps, where their expected wOBA this season is much higher than their actual wOBA.
Largest "unlucky" gaps between xwOBA and wOBA in 2019
Of 130 hitters with 450 PA
- Justin Smoak (TOR): 43 points -- .374 xwOBA | .331 wOBA
2-T) Lorenzo Cain (MIL): 37 points -- .335 xwOBA | .298 wOBA
2-T) C.J. Cron (MIN): 37 points -- .375 xwOBA | .338 wOBA - Marcell Ozuna (STL): 34 points -- .382 xwOBA | .348 wOBA
- Khris Davis (OAK): 30 points -- .312 xwOBA | .282 wOBA
MLB wOBA: .325
That gap can be the difference between a below-average season and an above-average season -- the case with Cain. It can be the difference between having solid numbers like Smoak's (102 OPS+), Cron's (110 OPS+) and Ozuna's (113 OPS+) and having great numbers.
Smoak and Cron have produced above-average hitting seasons by wOBA. But by expected wOBA, they're inside the top 15% of hitters. The 37-point gap between Smoak's expected and actual average (.248 vs. .211) and the 77-point gap between his expected and actual slugging (.482 vs. .405) are both the largest of the group. Cron feels his bad luck more in his slugging, which is 60 points lower than his xSLG (.545 vs. .485).
Ozuna might be the most interesting. His stat sheet numbers are good by themselves. But his expected stats put him right around the top 10% of hitters. Ozuna is ripping the ball. His 91.9 mph average exit velocity is stellar, higher than nearly all MLB regulars. His 50.3% hard-hit rate is elite, ranking in the top 5. Those numbers at least bode well for the Cardinals, who are hunting a National League Central title and a postseason run.
And in Davis' case, it could have made his quest for a fifth straight season of hitting .247 much easier, as his expected batting average (.231) is much closer to the mark than his actual batting average (.215) with time running out on 2019.
Extreme hitlessness.
We have to mention the two historic slumps this season -- Chris Davis' 0-for-54 that ended in April, and Daniel Palka's current season line of 1-for-54, an .019 batting average.
Davis set a Major League record with his hitless streak. Palka's season might be one of the most hapless of all time.
No position player has ever finished a season with at least 50 at-bats without getting more than a single hit. The lowest batting average ever in such a season was .056 by the St. Louis Browns' Lyn Lary in 1940, when he went 3-for-54.
Lowest BA for a position player in a season with 50+ AB
Modern era (since 1900)
Daniel Palka, 2019 (CWS): .019 (1-for-54) [ongoing]
Lyn Lary, 1940 (SLB): .056 (3-for-54)
Tom Nieto, 1988 (MIN): .067 (4-for-60)
Ron Karkovice, 1987 (CWS): .071 (6-for-85)
Jim Bolger, 1959 (CLE/PHI): .073 (4-for-55)
Mel Ott, 1946 (NYG): .074 (5-for-68)
Even for pitchers, only 10 have ever finished a season with 50 at-bats and a batting average lower than Palka's .019.
It's crazy to imagine a Major League hitter like Davis, a two-time home run champ, or Palka, who hit 27 homers just last year, stepping to the plate so many times in a row and coming up empty. Those are the type of stretches that make you wonder if a player has more than just bad luck -- they make you wonder if he's cursed.