

In baseball, bonkers stuff comes in bunches. So when we discussed some bonkers 2019 stats in this space at the beginning of September, we were only scratching the surface of the noteworthy numbers.
That’s why, here at the conclusion of another meticulously documented regular season of Major League Baseball, we’re back for more.
First, just to update you on what was, in my opinion, the craziest stat of all the last time we did this: Cody Bellinger finally homered off a pitcher for a second time. He got the Rockies’ Jake McGee twice in a span of three weeks. Prior to that second homer off McGee on Sept. 22, he had hit 45 homers off 45 different pitchers, which would have been a record.
Let’s have a brief moment of silence for our buried bit of Bellinger bonkersness.
Thank you.
Now, let’s proceed to the fresh batch…
7.12
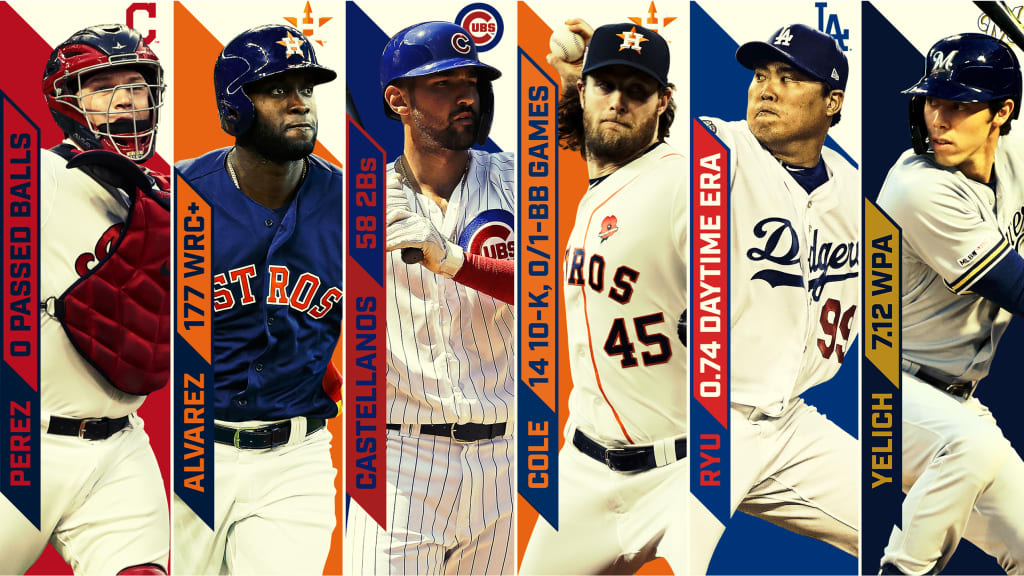
Christian Yelich’s Win Probability Added, as calculated by Baseball Reference. WPA is a measurement of how much a player impacted his team’s chances of winning from one event to the next. Yelich’s mark is not only tops in the Majors by a healthy margin (Mike Trout is second, at 5.2), but, with Yelich’s season cut short at 130 games played due to a fractured kneecap, it is the fourth-highest all-time for a player with 135 or fewer games played.
The only higher marks belong to Ted Williams (8.42 in 131 games in 1957), Mickey Mantle (7.99 in 123 games in '62) and Barry Bonds (7.97 in 130 games in 2003).
15
Walks for White Sox shortstop Tim Anderson, who won the American League batting title (.335 AVG). Previously, the fewest walks by a batting champ were the 19 for Nap Lajoie (.378 AVG) in 1902!
18-1
The Indians’ record vs. the Tigers, and the Astros’ record vs. the Mariners. In 50 seasons of divisional play, there had never been a season series in which one team beat another 18 times.
Then it happened twice in 2019.
The Indians’ plus-78 run differential against Detroit was the second-largest of the divisional era, trailing only the Dodgers’ plus-82 mark against the Padres in 1974. (Tip of the cap to our great researcher Sarah Langs for this note.)
14
Number of starts for Gerrit Cole in which he struck out 10 or more and walked one or zero. That is the most ever, surpassing Curt Schilling’s 13 such starts in 2002.
3
Number of Astros starters who finished the season with a sub-1.00 WHIP. Justin Verlander had a 0.80 mark, Zack Greinke was at 0.98 and Cole finished at 0.89. No team in the modern era has had that many qualified starters with a sub-1.00 WHIP (though obviously Greinke compiled 70 percent of his starts for the D-backs).
(Hat tip to Hall of Famer Jayson Stark of The Athletic for this one.)
177
More 'Stros stuff. This is Houston rookie sensation Yordan Alvarez’s weighted runs created plus. With power amplified across the league, it’s best to use a context stat like wRC+, which adjusts for league and ballpark, to evaluate a player’s performance. Alvarez has been 77 percent better than league average.
This is the highest wRC+ by a rookie with at least 250 plate appearances since “Shoeless” Joe Jackson’s 184 mark for the 1911 Cleveland Naps.
15
The number of games this season in which a team logged 20 strikeouts, an all-time record. Yes, strikeouts have been amplified in this era, but this is high even in that context. The previous high was just last year… with seven.
(This is another Sarah Langs Special.)
58
Doubles for Nicholas Castellanos. Unfortunately, a groin issue prevented him from a chance at becoming the first player since Joe Medwick and Charlie Gehringer in 1936 to reach 60. But the only other player since '36 with at least 58 doubles was the Rockies’ Todd Helton (59) in 2000.
12
The total number of teams in the AL with at least 90 wins (six teams … Yankees, Rays, Twins, Indians, Astros and A’s) or 90 losses (sixteams … Blue Jays, Orioles, Royals, Tigers, Mariners and Angels). The only other leagues in history to have at least six of one and five of the other were also both in the AL -- in 1977 and 2002. With the Angels' 90th loss on Sunday, it marked the first time in history that a league had at least six of each.
13
As stated in the last bonkers stats piece, it’s hard to know what to make of the many homer records being broken in 2019, given the environmental factors at play. But here’s another way of boiling things down to their essence: This is the record number of times this season a team has lost despite hitting five or more homers.
The previous high was nine, in 2000.
Minus-221
The Tigers’ run differential at home. That is the worst ever in a single season, per STATS LLC. The previous worst (minus-215) belonged to the 1883 Philadelphia Quakers, in the inaugural season of the franchise that would become the Phillies.
The Quakers managed to reach that minus-215 mark in just 50 games, going 9-40 (with one tie). The Tigers, meanwhile, went 22-59, giving them a .272 home winning percentage that ranks as the fourth-worst in the modern era and the worst since the 1939 St. Louis Browns (.234).
4.11; 3.83
We mentioned last time that the Astros are going to become the first team ever to have a pitching staff with the highest strikeout rate in the Majors and an offense with the lowest strikeout rate in the Majors. That’s exciting!
This … is less exciting. But still interesting … maybe.
Mariners hitters have seen 4.11 pitches per plate appearance, most in the Majors. Mariners pitchers have thrown 3.83 pitches per batter faced, fewest in the Majors. STATS LLC has pitch data going back to 1988, and a team has never led the Majors in both of these categories in a season. Celebrate, Seattle!
0
Passed balls attributed to Indians catcher Roberto Pérez. He is just the fourth backstop with at least 900 innings caught and zero passed balls, joining Johnny Bench (1975 Reds), Milt May ('77 Tigers) and John Flaherty ('95 Tigers).
17
Losses by the Blue Jays in Interleague Play. That’s the most ever. Prior to this season, no team had lost more than 15 Interleague games.
.676
The Dodgers’ winning percentage against fellow National League teams. That’s the highest by an NL team in its own league since the 1953 Dodgers posted a .682 mark.
57.3
As calculated by FanGraphs, this is the total WAR for rookie position players this season -- the second-highest of all time. Only the 2015 class (fronted by Kris Bryant, Carlos Correa and Francisco Lindor) ranks higher.
0.74
Hyun-Jin Ryu’s ERA in day games, with 61 innings pitched. That’s the lowest ever for a live-ball-era pitcher with at least 50 innings in day games. The previous low was Tim Wakefield’s 0.89 mark (50 1/3 innings) with the 1995 Red Sox. Ryu has a 3.11 ERA in night games.