

More than 219,000 games and 3.9 million innings into this thing we call Major League Baseball, and players and teams are still finding ways to do things that have never been done before. Baseball is a numbers game, and sometimes the numbers leave us numb with disbelief.
So it is once again in this 2019 season, which has satiated our collective desire for the obscure and unbelievable from a statistical perspective.
Here’s a rundown of some bonkers stats from this season.
1,410 and 1,000
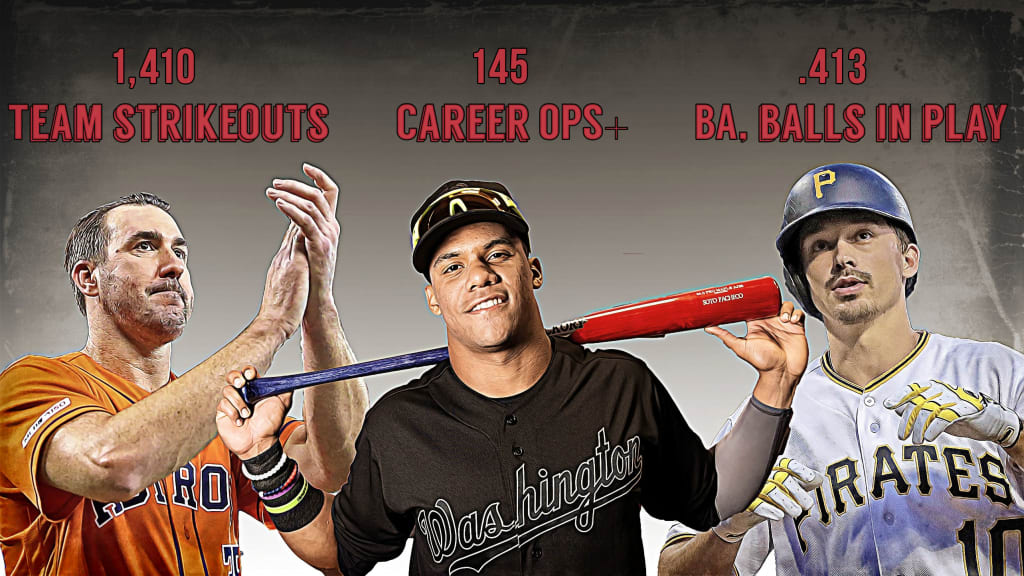
The first number is the number of strikeouts notched by Astros pitchers this season. That’s the most in baseball.
The second number is the number of strikeouts notched by Astros batters this season. That’s the fewest in baseball.
Has a team ever led the Majors in strikeouts by its pitchers while its hitters led the Majors in fewest strikeouts?
No, of course not. And that’s why it’s bonkers.
But wait, we’re not done with the Astros …
0
This is how many intentional walks Houston has issued this season. Since Major League Baseball began recording the stat in 1955, no team has ever gone an entire season without issuing one. The closest anybody came was -- you guessed it -- last year’s Astros, with four.
But while Houston takes this idea to the extreme, it isn’t isolated to the Astros. Five other teams (the Rangers, Orioles, Yankees, Twins and Angels) entered the week with less than 10 intentional walks. With the league-wide ground-ball rate having declined in recent years and more home runs being hit, setting up the double play -- and inviting greater risk of a two-run homer -- makes a lot less sense.
0
This is also how many Angels pitchers have reached 100 innings or 20 starts so far this season. According to Baseball-Reference.com, no team in the modern era (dating back to 1901) has ever had zero pitchers reach 100 innings, and only one team (the 1919 Phillies) has not had a pitcher make at least 20 starts.
Trevor Cahill is the Angels’ only hope of having a 100-inning pitcher. He went into Labor Day with 91 1/3 innings and is used regularly out of the bullpen. If Cahill is the only one to make it (Andrew Heaney is next closest, at 75 2/3), the Angels will join the 2012 Rockies (Jeff Francis) as the only modern-era teams with a single 100-inning guy.
But the 20-starts threshold will not be met by any member of the Angels’ staff. Griffin Canning had 17 starts before he was shut down with right elbow inflammation, and the late Tyler Skaggs had 15 starts. Heaney leads Halos active pitchers with 14 starts, so he’s going to run out of time to reach 20.
Hat tip to @simon_shargot of The Score for pointing us to this one.
182
Well, you knew, especially after bringing up the Angels, that we had to bring up Mike Trout. This is Trout’s OPS+ entering the week, which is a player’s on-base plus slugging percentage adjusted for external factors like ballparks and normalized for the league average. A 182 OPS+ means your offensive performance is 82 percent better than the league average.
The fact that Trout is leading the American League (and, for that matter, all of MLB) with a 182 OPS+ is not bonkers. What’s bonkers is that Trout is certain to lead his league in OPS+ for a fifth straight year. The only other players to do that are Ty Cobb, Babe Ruth, Rogers Hornsby, Mickey Mantle, Mike Schmidt and Barry Bonds.
If he can fend off Christian Yelich (175) and Cody Bellinger (174), Trout will lead all of MLB in OPS+ for a fourth straight year. Only Cobb, Ruth and Bonds have done that.
145
It was nice when Juan Soto reached 30-plus homers in his age-20 season, making him the first to do so since Trout in 2012. But given the league-wide home run rate, a stat like OPS+ that relays performance relative to the league average, is more important. And here, too, Soto shines.
This is Soto’s career OPS+ (it was 142 in his dynamic rookie year at age 19, and it’s 145 in his dynamic sophomore year at age 20). Among those with at least 1,000 plate appearances prior to their age-21 season, the full list of the only other players in history to have a career OPS+ this high is as follows:
Ty Cobb: 145
Mickey Mantle: 144
Mel Ott: 144
Those guys are all Hall of Famers, if you’re scoring at home.
63.01
This is the Major League save percentage -- the third-lowest all-time, trailing only 1951 (45.1 percent) and 1974 (61.5 percent).
In a related development, the 4.50 Major League-wide relief ERA is the ninth-highest on record and the highest since 2000 (4.58).
With so many blown saves and teams increasingly rotating various guys in the closer's role, the 40-save reliever is an endangered species. The Padres’ Kirby Yates (39) and the Yankees’ Aroldis Chapman (36) entered the week on track to get there, and the Indians’ Brad Hand (33) was right on the cusp. If we only end up with two 40-save guys, that will be the fewest since 1988 (Dan Quisenberry and Bruce Sutter).
8
Reds rookie manager David Bell is mild-mannered in most aspects of the managerial job, including daily media briefings that are about as spicy as a regular rice cake.
But cross his team between the lines, and Bell can rage with the best of them. He’s been ejected eight times this season -- or 6.2 percent of the games he’s managed (not counting the seven total games he’s been suspended). Not only does that total tie his father Buddy’s season high (in both 2000-01 with the Rockies) and set a Reds managerial record, but, per the ejections data at Baseball-Reference.com, it’s the most ejections for a rookie manager since Bill Rigney (also eight) with the 1956 New York Giants.
The record number of ejections for a rookie manager (non-player manager) belongs to Burleigh Grimes of the 1937 Brooklyn Dodgers, with nine. So Bell has a shot at heave-ho history in the home stretch.
.413
This is Bryan Reynolds’ batting average on balls in play. It’s why the Pirates' rookie outfielder is vying for the National League batting title (his .335 average entering Labor Day was two points behind NL leader Anthony Rendon).
In the modern era, the only players with a higher BABIP in a full season were Ruth (.423, 1923), George Sisler (.422, 1922), Hornsby (.422, 1924), Cobb (.416 in 1922 and .415 in 1923) and Harry Heilmann (.414, 1923).
499
With all kinds of homer records being broken this year (exactly half of the 30 teams are on pace to break their franchise mark), there’s no point in dwelling on the long ball too much here. But if you really want the bottom line on what a home run-heavy game it is in 2019, look at the bottom of the order.
Across baseball, No. 8 hitters had hit 499 homers as of Labor Day. That put them on pace to hit 591 -- a total that would be right in line with what cleanup hitters hit in 1971 (590) and higher than 54 other seasons in the live-ball era (dating back to 1920). As recently as '92, cleanup hitters hit just 607 homers.
OK, so there were fewer teams -- and therefore games -- in all of those years. Fine. So let’s go by rate: At a home run every 28.85 at-bats, No. 8 hitters are going deep at a faster rate than cleanup hitters in 29 other live-ball-era seasons, most recently 1974 (30.97), per STATS LLC.
No. 9 hitters, meanwhile, are going deep every 38.04 at-bats. That’s better than cleanup hitters in 13 live-ball seasons, though none since World War II.
14 and 11
Of course, when the home run numbers are bonkers for the batters, they tend to get bonkers for the pitchers, too. Even after Sunday’s no-hitter, Justin Verlander, for example, is in contention to allow the most home runs in the AL this year, while potentially winning the Cy Young Award.
That’s … unusual.
But then there’s Dodgers reliever Yimi Garcia, owner of the above numbers. Fourteen is his number of home runs allowed. Eleven is his number of singles allowed. Garcia could become the first pitcher in history to give up a double-digit homer total while allowing fewer singles than home runs.
The Brewers’ Josh Hader is in similar territory, entering the week with 13 homers and 13 singles allowed. And here you thought the postseason race was the most interesting reason to watch the Brewers down the stretch …
Hat tip to @ericstephen of SB Nation, whose tweet about Garcia’s stats last month first brought this bonkers bit to our attention.
44
All right, fine, one last home run stat. But trust me, this is bonkers.
This is Cody Bellinger’s home run total. Yet 44 is also the number of different pitchers Bellinger has taken deep this season. Indeed, as of this writing, he had yet to take the same pitcher deep twice.
The only player in history to go an entire season hitting at least 40 homers off all different pitchers was Albert Pujols, with 40 in 2015.
Thanks to Christopher Kamka (@ckamka) of NBC Sports Chicago for pointing us to this.