

Back in 2017, a then-19-year-old Ronald Acuña Jr. appeared in Miami at the Futures Game. He had the hardest-hit ball of the evening, but he also showed off his arm, uncorking a pair of throws -- each tracked at over 95 mph. "[Those throws are] something that I do all natural," Acuña said at the time. "I don't try to do too much. [My arm strength] is just something natural."
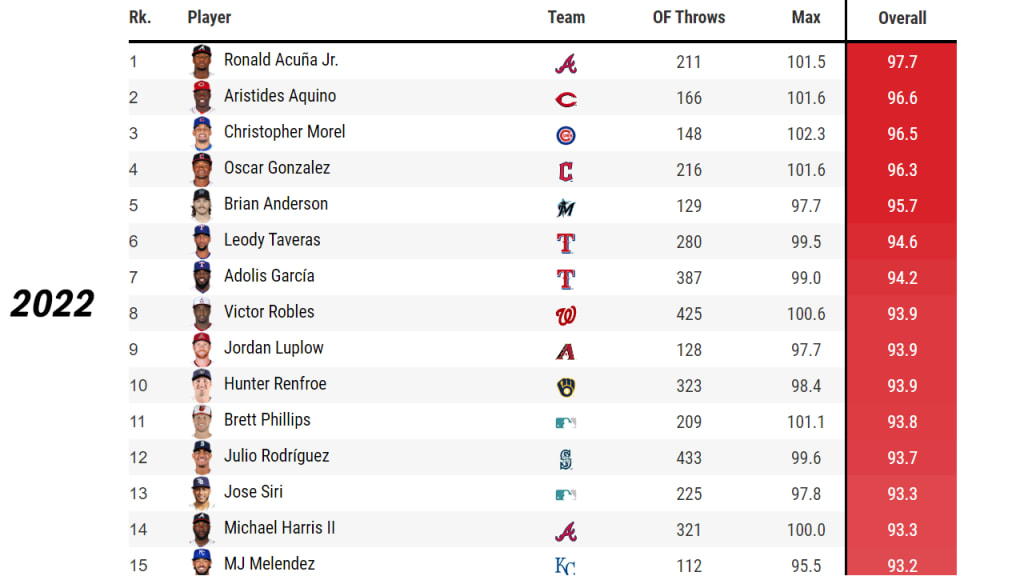
Five years later, Acuña is a three-time All-Star, a Rookie of the Year Award winner, and a World Series winner. He’s also, so far as Statcast is concerned, the owner of the strongest throwing arm in baseball this season -- or at least that’s what being atop the newly released arm strength leaderboards for position players, available publicly for the first time, would imply.
These are available back to 2020, that being when Hawk-Eye was installed in all 30 stadiums as the hardware that powers Statcast. (Previous individual throws are still valid -- Aaron Hicks touching 105.5 mph back in 2016 is still the hardest throw on record -- but season averages are not available for those years just because fewer throws were tracked.)
If you want to get to the fun stuff -- the leaderboards, and fun questions about them -- feel free to skip to the part about Oneil Cruz. If you want to understand how it all works ... stay right here.
How does all this work?
You’d think measuring throwing arm strength would be easy. You’d be surprised at how complicated it gets.
When you measure a pitcher’s average fastball velocity, it’s simple. Most of a pitcher’s fastballs are thrown at or near the same velocity, so you average them all together and call it a day -- it’s not like Max Scherzer is throwing some four-seamers at 95 mph, and others at 72 mph.
But that’s hardly true for position players, where you might sometimes be throwing at your maximum effort (here’s Julio Rodríguez with a 99.6 mph cannon to nail a runner at third base) and sometimes you are absolutely not (here’s Rodríguez with a 21.6 mph [!] lob after catching the third out of an inning).
You don’t want to average all of those together, because so much of it just doesn’t matter, and there’s not exactly a rulebook definition for “was trying.” For Rodríguez, for example, he has over 430 tracked throws, but nearly 80% of them are under 80 mph. There’s a lot of lobs and non-competitive throws. In order to account for that, outfielders receive the average of their top 10% hardest throws as a seasonal average. For Rodríguez, that’s 43 throws. Here’s what his 43rd-hardest throw looks like – it’s clearly one he’s putting effort into.
But it’s also clear that it doesn't work for other positions. White Sox first baseman José Abreu has about the same number of tracked throws as Rodríguez does. Here’s what his 43rd-hardest throw looks like. Hardly the same, is it?
To get past that, the averages work like this. Outfielders get the average of the top 10% of their throws. Non-first base infielders get the average of the top 5% of their throws. And first basemen, who hardly ever need to throw hard -- only 10 tracked throws all season above 85 mph -- get the average of their top 1%.
That out of the way, let’s ask some of the fun questions.
1) Oneil Cruz has to be the hardest-throwing shortstop, right?
Yes. Obviously. Potentially ever, though we certainly can’t go back through history here to see how hard Shawon Dunston or whatever shortstop of your choice might have thrown. After all the hype over Cruz’s 97.8 mph dart in July that stands as the fastest throw on an infield assist Statcast has tracked, he’d better be atop a list like this, and he is, by a pretty large 4 mph gap over Cincinnati's José Barrero. He’s also No. 1 among shortstops over the last three years, ahead of Fernando Tatis Jr.
Cruz has five of the six hardest shortstop throws this year, and eight of the top 13. Going back to 2015, he has two of the three hardest throws ever tracked by an infielder. Any infielder. He's barely a half-season into his career.
2) How much does throw speed matter?
Some, obviously, but it’s not everything. We’re talking raw speed here, not accuracy. It’s sort of like pitching; all things being equal, you’d much rather throw 100 mph than 90 mph, but it also might not matter so much if you can’t throw strikes.
What a strong throwing arm does, mostly, is make things happen faster. It gets you from Point A to Point B more quickly.
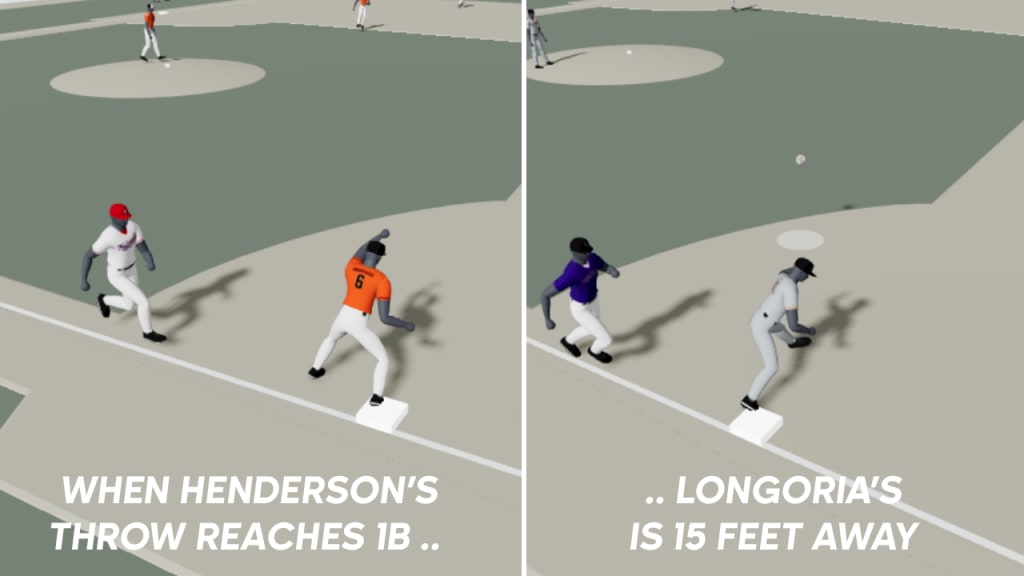
Henderson’s throw was clocked at 85.2 mph, and took 0.87 of a second to reach first base. Longoria, who at nearly 37 years old has the weakest qualified third base arm (75 mph), got his off at 76.6 mph ... and it took his throw 0.97 of a second to get to first.
Hard to see a difference with the naked eye, right? And a tenth of a second really doesn't sound like very much.
Then again, Henderson’s throw got there about 11% faster. At the time his throw slapped into first baseman Ryan Mountcastle's glove, Longoria's throw was still 15 feet away from his own first baseman, Wilmer Flores. Let's freeze the play to show you exactly what we mean:
If you check out the pop time leaderboards, the gap between “absolute best” and “dead last” is just 0.28 seconds. On the home-to-first leaderboards, the same gap -- between truly elite speed and a catcher with bad knees -- is all of 1.23 seconds.
Baseball is largely played in terms of feet and seconds, and they all add up quickly.
3) Players throw differently at different positions, right?
Yes, of course. A good example of this is Cubs rookie Christopher Morel, who has a 96.5 mph competitive average as an outfielder -- maxing out at 102.3 mph -- and a 90.4 mph competitive average as a second baseman, maxing out at 90.9 mph. His 10 hardest throws of the season are as an outfielder, and his 20 hardest throws are at positions other than second base.
It’s not that his arm suddenly got weaker on the right side of the infield, of course. It’s that the demands of different positions are, well, different. Outfielders can get a running start, preparing for a long throw. Infielders have less time to throw shorter distances. As MLB.com Tom’s Tango has detailed, when looking at players who have played multiple positions, outfielders consistently throw about 3 mph higher than themselves at shortstop and third, 7 mph higher than at second, and 10 mph than they are at first base.
Which is a great lead-in to our next question ...
4) Do second basemen have weaker arms than shortstops because they don’t need to throw as far? Or is it because players with weaker arms are less likely to be allowed to play the left side in the first place?
It’s the chicken-and-the-egg question of our times. Just look at the 2022 averages on competitive throws from those positions.
2B: 81 mph
SS: 85.9 mph
3B: 85.7 mph
It’s an important one, too. Take Boston second baseman Trevor Story, who had been a very good shortstop with Colorado, and may yet be again if Red Sox shortstop Xander Bogaerts chooses to opt out this winter and depart.
In 2020, Story averaged 82.3 mph as a Rockies shortstop -- a good-not-great number, slightly below average for shortstops. In 2021, still at shortstop, that was down to 79.1 mph, largely believed to be related to a midseason elbow injury. In 2022, that’s down again, to 76 mph. So is that because the elbow isn’t allowing harder throws -- not that it’s mattered much, as he’s been excellent defensively -- or because his new position doesn’t demand it?
One answer to that is in the context of his new position; 76 mph is one of the weakest marks of any regular second baseman. But there’s also this, that Story has 195 tracked throws of at least 80 mph in his career -- he even topped 90 a few times early on -- but it’s happened only once since the 2021 All-Star break. It’s been well over a year since his last 80 mph+ throw, much of which he spent at shortstop; Arizona’s Ketel Marte, comparatively, has six such throws just this month.
It’s hard to think it’s entirely about Story’s move to the right side. That holds true when you realize he’s still played some left side in the shift, and his hardest throw from there was this 75.1 mph throw in April. (He has 14 harder throws from the right side, though obviously in far more opportunities.)
But the counterbalance to that is looking at a handful of infielders who have played on both sides of the bag just this season. (For this, we’ll just look at throws on fielded balls, not outfield relays or double play pivots.)
Take Tommy Edman, who has moved back and forth between both spots. His 10 hardest non-relay/pivot throws on the right side of the infield average 75.7 mph, maxing out at 78.2 mph. On the left side, it’s higher: 81.5 mph on average, maxing out at 84.9 mph.
In fact, if we look at the 16 fielders who had enough throws to qualify at both second base and shortstop this year, plus Story, and look at their comparisons on both sides of the bag ... every single one had a harder average throw from the left side than the right side, by an average of 5.3 mph.
Every one, that is, except Story. So the answer here might really be more than one answer, in that infielders who spend times on both sides of second base seem to throw harder from the left side, and Story might best be served as a second baseman going forward.
5) Wait, is Mike Trout actually improving at yet another thing?
Trout might be the best player to ever live when all is said and done, but for years, he was never really a “five-tool player” because his throwing arm wasn’t really a strength. We don’t have Statcast from the early days of his career, of course, but we do have articles from way back in 2014 titled “Trout working hard to improve arm strength.” In 2019, the L.A. Times detailed the work he’d put into improving that relative weakness.
And now?
In 2020, his average on competitive throws was 86.6 mph, an almost exactly-average number. In 2021, before he was injured, that went up to 88.2 mph. This year, that’s all the way up to 90.7 mph, which is about 75th percentile among outfielders. In early September, he tried to throw out Jose Altuve, who was tagging up on a sacrifice fly. He was unsuccessful, but the throw was tracked at 94.8 mph. It was his hardest throw in nearly three calendar years.
6) Do first basemen really ever have to throw hard?
Sure ... but mostly on relays home from the outfield, or sometimes on double play attempts.
In eight years of Statcast tracking, only two first baseman throws have come in above 91 mph, and each of them -- both from Vladimir Guerrero Jr., one shown below -- were on relays. Compare that, for example, to the 211 such throws from shortstops, or the nearly 2,500 from right fielders (which almost certainly underestimates the truth in the early years).
That "throwing hard" is rarely a demand of the position is somewhat reflected in the leaderboards, which has many first basemen near the bottom. Some of them might just have weak arms, which is why they're at first base in the first place. Some, though, might just not have had the opportunity elsewhere to show it.
Paul Goldschmidt, for example, is an MVP candidate this year, and a borderline Hall of Famer. He's also had nearly 2,000 tracked throws since Statcast came online in 2015, and exactly one of them -- one! -- came in above 72 mph. (And even that one, a force out at home plate, came back in 2015.). Meanwhile, Boston's Bobby Dalbec currently shows up with a 74.8 average as a first baseman, but he's got plenty of throws north of 80 mph as a third baseman (and, once, a shortstop). He just hasn't thrown enough to qualify yet from those spots, and when he does, he'll look like he has a considerably better arm than Goldschmidt ... which he does.
7) Where can I find this all again?
Right here, at the Baseball Savant leaderboards, as well as on appropriate player pages.