

“This is a quick, strong game,” said legendary hitting scientist Ted Williams in a 1986 conversation with Sports Illustrated. “I want to get the bat there as quickly as I can.” Ten years later, future Hall of Fame slugger Jeff Bagwell echoed the same point to the same magazine. “Guys are looking for bat speed," Bagwell told Tim Kurkjian. "Bat speed creates home runs. Who wouldn't want that?"
Clearly. Hitters have wanted to have a quick bat since essentially the day a 19th-century striker first picked up what passed for a bat in those days. It’s not terribly surprising to learn that batters would like to swing hard, when they can; after all, a fast swing will transfer more energy to the baseball, and you generally want the baseball to move fast and go far. If pitchers keep working to increase the velocity of their fastballs, why wouldn't batters do the same in response?
In more recent years, hitters like Mookie Betts, Ty France, and Lars Nootbaar -- among others -- have openly talked about bat speed increases being a training goal, in the same way that pitchers work to throw harder. In a game where fractions of a second matter, having the ability to swing even fractionally faster would obviously be a nice advantage to have over other, slower bats.
Of course, it’s difficult to know if you’re swinging the bat faster if you don’t even know how fast you’re swinging the bat in the first place. For most of baseball history, that’s been close to impossible, though it hasn’t prevented people from trying.
In 1920, Prof. A.L. Hodges, “the Well-Known Physicist,” wrote that Babe Ruth had “a 44 Horse-Power Swing Which Shoots the Ball Skyward at Six Miles a Minute,” a fascinating attempt at an early version of Statcast. (We regretfully will not be expressing current-day bat speed in Horse-Power.) In 1992, the Chicago Tribune commissioned baseball physics legend Robert Adair to explain what the bat really does; in recent years, bat speed could be directly tracked in hitting laboratories owned by teams or third-parties, usually with wearable technology, or by occasional releases of in-stadium Statcast testing data over the last few seasons.
Now, the testing is done. The public leaderboards are here. In a sport where winning and losing is so often about what happens in the batter's box, we’ve known so much more about what the pitchers do with their weapon (the baseball) than what the batters do with theirs (the bat). New to Baseball Savant, the first wave of public, daily bat-tracking metrics has arrived. (Data goes back to April 3 -- shortly after the start of the 2024 season -- with any previous data treated as testing-only.)
Each year, including the postseason, there are nearly 350,000 swings. Let’s learn a whole lot more about them.
What are we measuring?
In each of the 30 Major League parks, there are five high frame-rate Hawk-Eye cameras, which help us track not only the speed of the bat, but also the path it takes and its location in physical space, as well as in relation to the ball coming toward it.
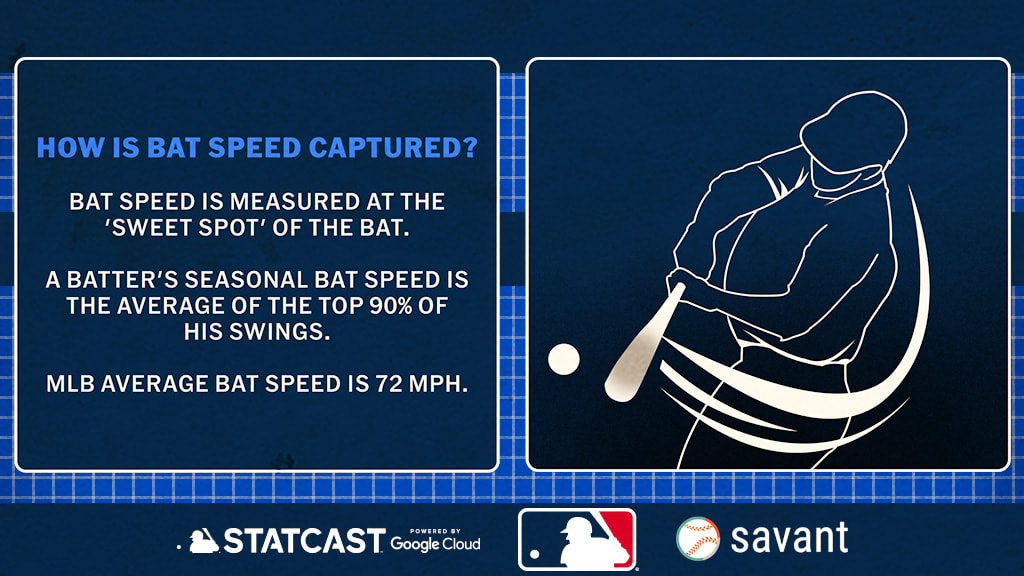
The speed of the swing is measured at the sweet spot of the barrel, approximately six inches from the head of the bat, and this is an important distinction, because the different parts of the bat move at different speeds. Since this is where the batter is generally trying to hit the ball anyway, and it’s the industry standard, it’s what we’ll use here as well.
So, when Giancarlo Stanton crushed a home run at 119.1 mph last week, it was with a swing of 83.7 mph, one of his 20 hardest swings of the season, and well above the Major League average of 72 mph. It had a swing length of 8.6 feet, also above the average of 7.3 feet -- and it was 100% squared up.
If none of that makes sense yet, it shouldn't; it's all brand new, and we'll detail each metric below. For Stanton's blast, it looked to the cameras like this:
All those numbers will make more sense as we take you through the six newest Statcast metrics: Bat speed, fast-swing rate, squared-up rate, blasts, swing length, and swords.
(What’s not here? It’s important to note that what’s currently displayed is merely the first wave of a number of data points. For example, who swings with the steepest attack angle? Which pitcher misses bats by the most distance? Who is the earliest or latest on their swings? Who’s making contact out front, or not? Those, and several other ideas, are in the future pipeline.)
Bat speed
This is the obvious baseline, like fastball velocity for a pitcher. It’s not everything, but it’s important. As the science goes, on balls hit in the air, every 1 mph of bat speed earns you approximately six more feet of distance, which is enough to turn a warning track flyout into a home run -- which is wildly valuable.
When you show the distribution of all the swings in 2024 so far, you get a visual that looks like this, showing the MLB average swing is 72 mph -- and that two-thirds are between 68-77 mph.
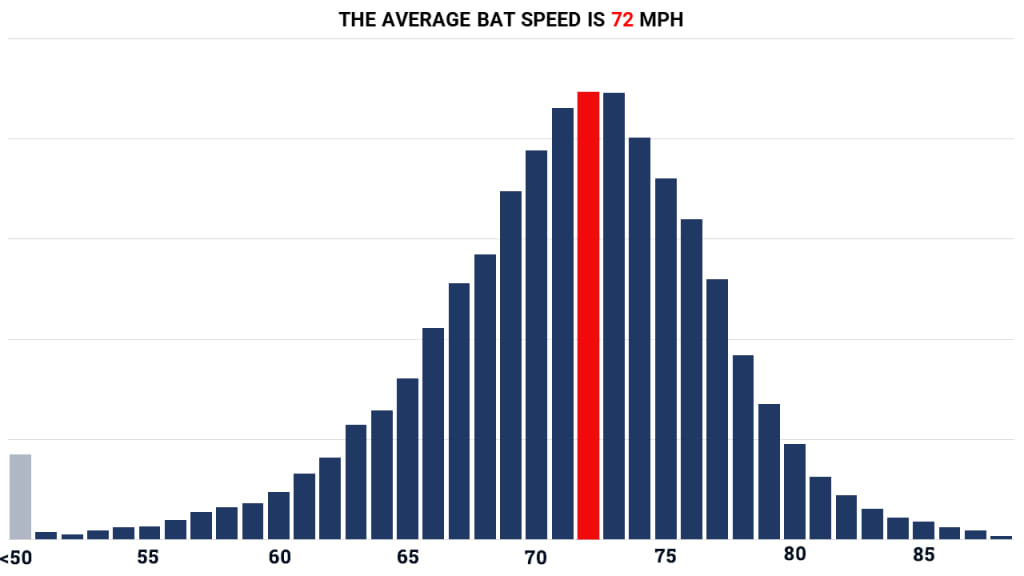
A player’s seasonal ‘average’ is taking the average of the top 90% of his swings, because we’re just not that interested in what happens on check swings or bunts, at least for this purpose.
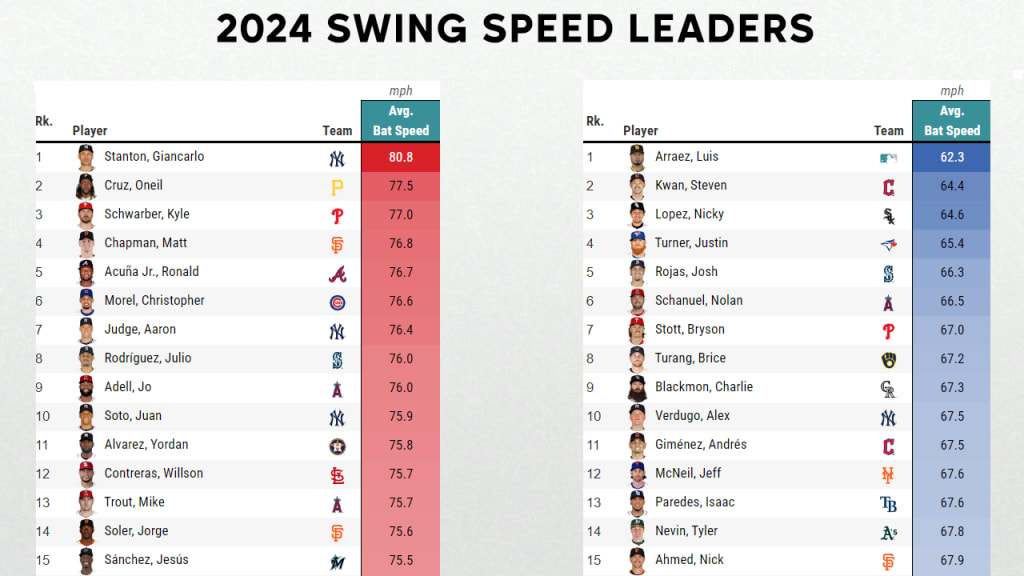
The average swing is 72 mph, and the spread here is approximately 20 mph from slowest (Luis Arraez, 62 mph) to fastest (Giancarlo Stanton, 81 mph), with the most “average” player here being something like Ke’Bryan Hayes or Edouard Julien. For the most part, the top and bottom of the leaderboards for batters will be full of very satisfying and expected names.
Oh, no: Another reason that Statcast doesn’t respect Arraez, right? Not quite. Slower doesn’t always mean worse; sometimes it just means different, in the same way a pitcher with a below-average fastball might still find a way to succeed.
So why does any of this matter? After all, it’s not like very many people would prefer Stanton over Steven Kwan in their lineup, right? It’s sort of like fastball velocity, where you’d obviously prefer to have it than not have it -- and in the aggregate, it’s much better to have it -- but throwing 98 mph doesn’t automatically make you more productive than someone who throws 92. It's a tool, not the answer.
Still, the data makes it pretty clear. If you’re not an outlier unicorn in terms of bat control like Kwan or Arraez, you’d probably like to swing hard if you could.
80+ mph bat speed
- .321 BA / .665 SLG / .419 wOBA
- 52% hard-hit rate / +2 run value per 100
70-79 mph bat speed
- .274 BA / .477 SLG / .322 wOBA
- 46% hard-hit rate / -1.5 run value per 100
0-69 mph bat speed
- .202 BA / .254 SLG / .205 wOBA
- 29% hard-hit rate / -4 run value per 100
The average home run bat speed, for what it’s worth, is 75 mph. When we checked, it was more than a little pleasing to find that that the two slowest home runs swings so far came from A) the pull-hitting king who breaks all our models -- in Coors Field, of all places [63 mph, Isaac Paredes, April 6], and B) a classic Yankee Stadium short porcher off the foul pole [63.1 mph, Jose Trevino, April 25]).
Speaking, though, of 75 mph …
Fast-swing rate (75+ MPH)
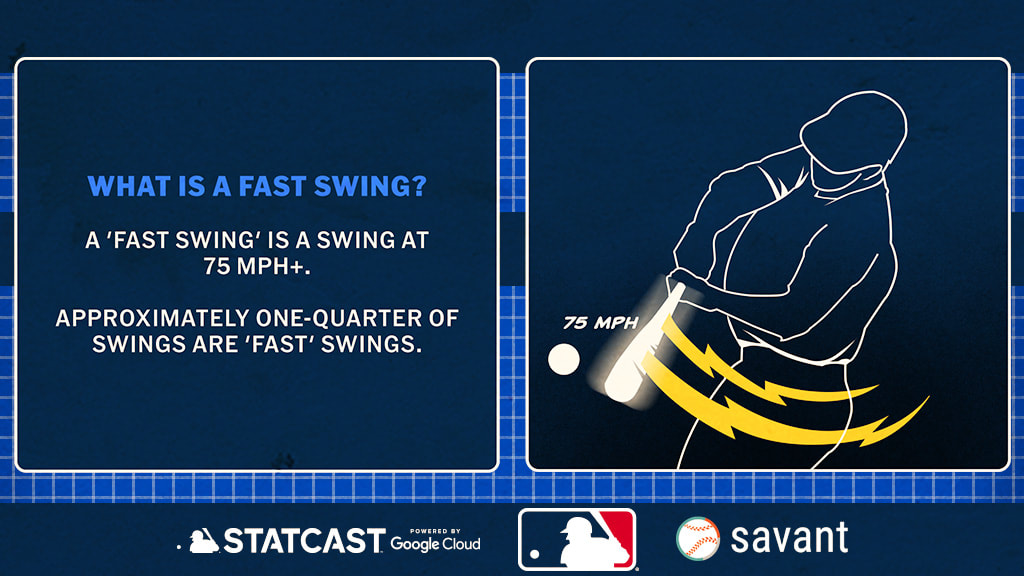
In somewhat of a similar way that a hard-hit ball is one that’s hit with an exit velocity of 95 mph or higher, a fast swing is one that comes in at 75 mph or more. That’s a definition that applies to only about 23% of swings. Most swings aren’t fast swings. A number of players, like Arraez and Kwan, don’t have a single one. Guess who swings fast the most often? That’s right. Stanton, forever the king, no matter the situation.
Why was 75 mph chosen? Not specifically because that’s the average home run swing, although that is a pleasing, happy accident. It’s because that’s the line where, on a per-swing basis, a swing goes from negative run value for a hitter to average, on its way to positive.
There’s obviously a great deal of overlap with swing speed here, but this can also tell you something about a hitter’s approach.
For example, Stanton and Oneil Cruz have the two fastest swings in the game, but Stanton’s fast-swing rate of 99% -- that’s right, he swings hard almost every single time no matter what -- is well above Cruz’s 72%. When you compare the distribution of their swings, you can see what’s happening here. Stanton doesn’t really vary his approach. Cruz, however, does, slowing down about one-quarter of his swings beneath the fast-swing line.
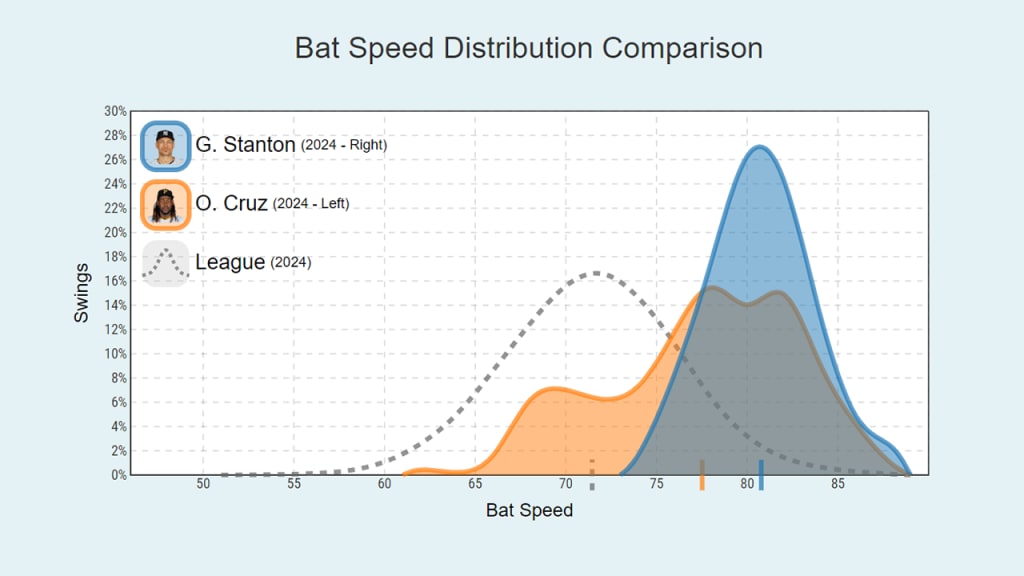
Again, while it’s not a one-size-fits-all thing -- overall, you’d like to swing fast.
75+ mph bat speed
- .306 BA / .603 SLG / .388 wOBA
- 52% hard-hit rate / +0.5 run value per 100
0-74 mph bat speed
- .247 BA / .371 SLG / .267 wOBA
- 36% hard-hit rate / -3 run value per 100
Squared-up rate
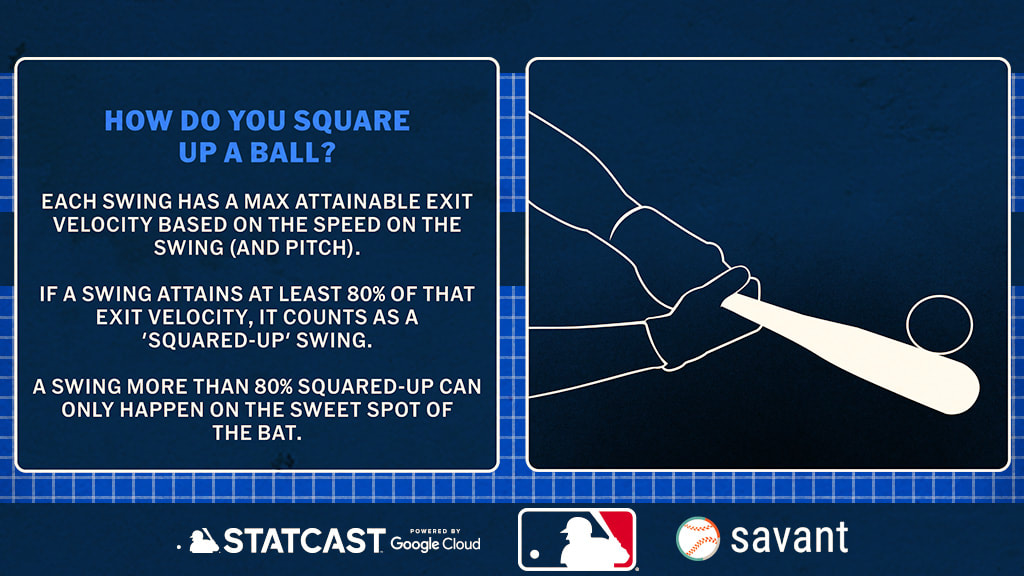
This one’s for you, contact hitters of the world, because this one tells you how effective a hitter is at actually obtaining a swing’s maximum exit velocity, based on what’s possible considering the speed of the swing and pitch. (Like with exit velocity, the batter is responsible for something like 80% of that.)
For example, when Elly De La Cruz smashed this homer last month against Milwaukee, he swung at 77.3 mph against a 93.6 mph pitch. The maximum exit velocity he could have generated there was 114.8 mph and he actually generated 112.3 mph, so that’s 98% squared up -- which really can only happen in the sweet spot of the bat.
It doesn’t have to be a fast swing or a hard-hit ball, though, and that’s the trick. When Arraez singled off Camilo Doval in April, he put a 66.4 mph swing on an 89.1 mph pitch, so while his slow swing limited his maximum exit velocity to 100.1 mph, the fact that he actually got 98 mph out of it means that he, too, was 98% squared up.
Any swing that’s at least 80% squared up is considered to be, well, squared up, and as you’d expect, this is where Arraez absolutely shines, topping the leaderboard. He’s done that more than 80 times, the most in the Majors, and on the highest rate of his swings.
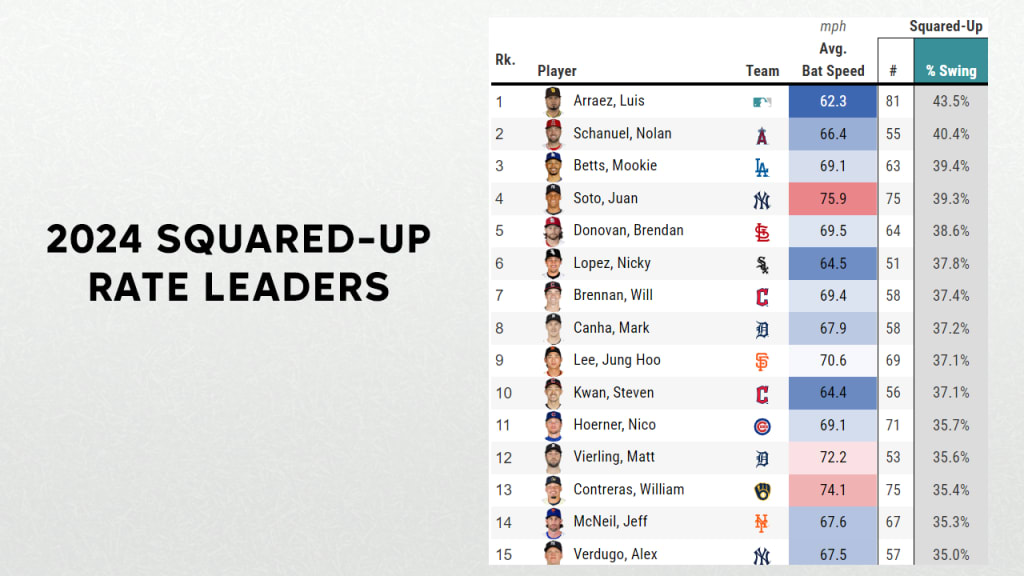
If that looks like “a list of soft swings and also ohmygosh Juan Soto,” we would agree -- he squares up like Kwan and swings with 96th percentile speed.
Squared-up
- .372 BA / .659 SLG / .439 wOBA
- 59% hard-hit rate / +11 run value per 100
Not squared-up
- .127 BA / .144 SLG / .125 wOBA
- 1% hard-hit rate / -6 run value per 100
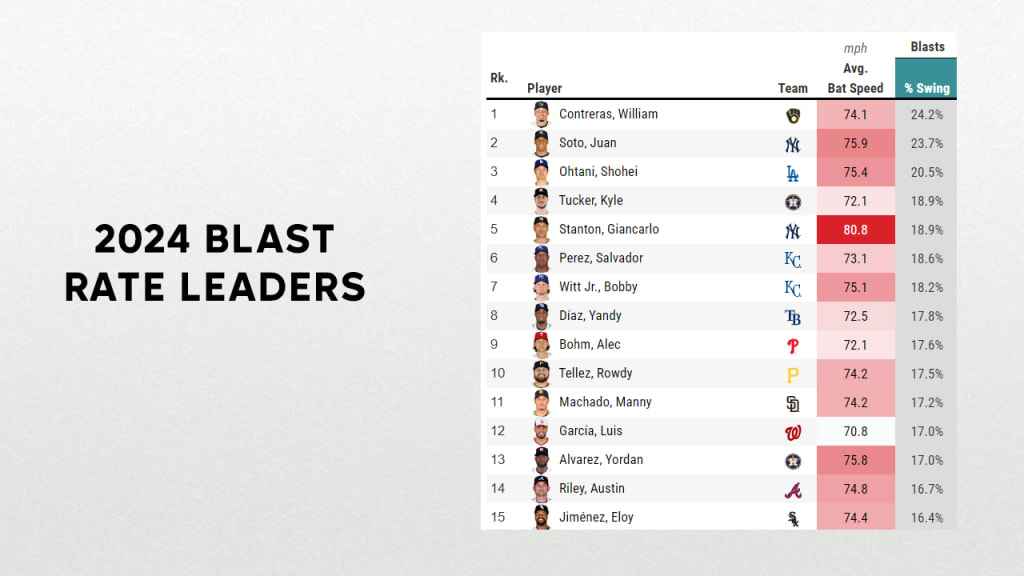
Blasts
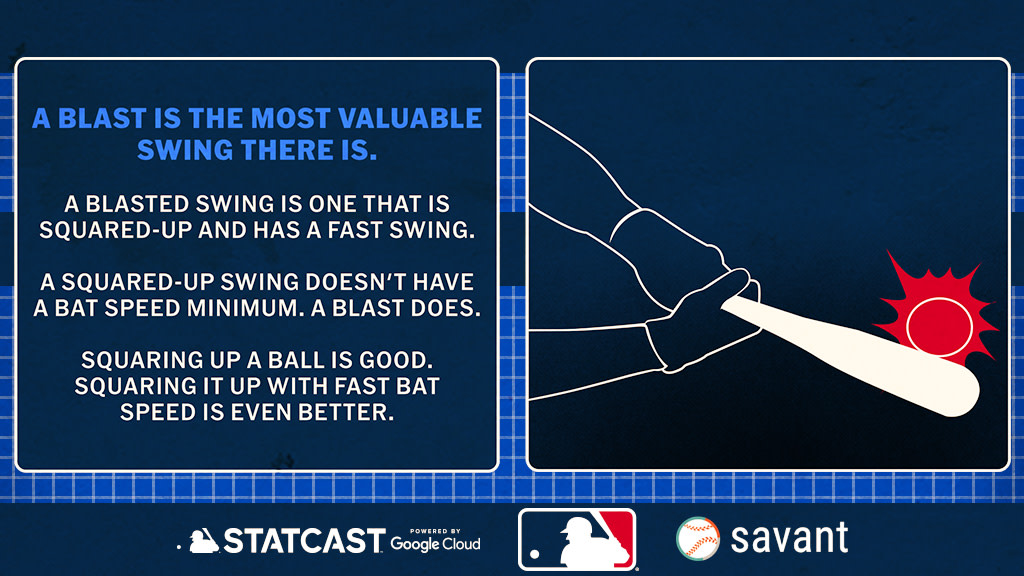
One thing squared-up rate does not require, however, is a fast swing, which is why Arraez is so good at it. But what if it did? That’s what a blast is, and it’s something you want to do, because only 7% of swings qualify here.
The outcomes are … favorable, to say the least, especially if things like “do this and gain 900 points of slugging percentage” interest you.
Blasts
- .546 BA / 1.116 SLG / .706 wOBA
- 99% hard-hit rate / +32 run value per 100
Not blasts
- .178 BA / .224 SLG / .175 wOBA
- 17% hard-hit rate / -6 run value per 100
Remember, that’s all based on what’s known only from the bat speed, pitch speed and exit velocity, nothing more.
A blast, technically, is “when a batter squares up a ball and does so with a minimum amount of bat speed,” and even more technically is “when percent squared up*100 + bat speed >= 164,” but an easier shorthand way to consider it is that the average between squared-up rate and bat speed has to be at least 82 in order to be a blast.
The point is, this is where The Big Boys Live.
It's not a surprise that Soto and Shohei Ohtani do this a lot. It might be a surprise that William Contreras does it even more.
Swing Length
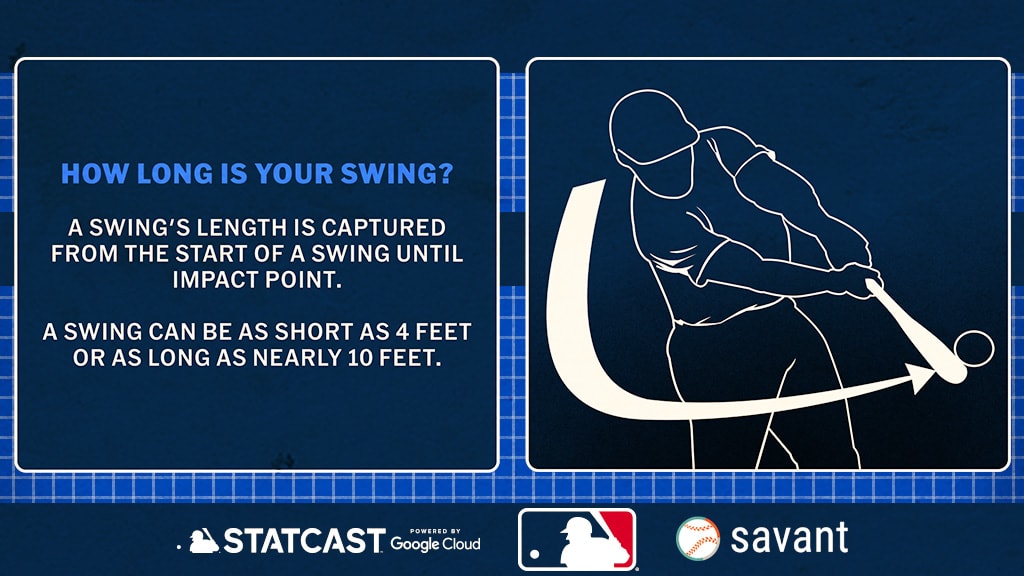
You already know what this looks like, of course. You know what a short and long swing looks like. Here’s a long swing, at 9.7 feet, from Stanton. Here's one of the shortest ones (non-bunt or checked swing division), from Arraez, at just over 4 feet. Here's what the cameras saw -- not hard to notice the difference, is it?
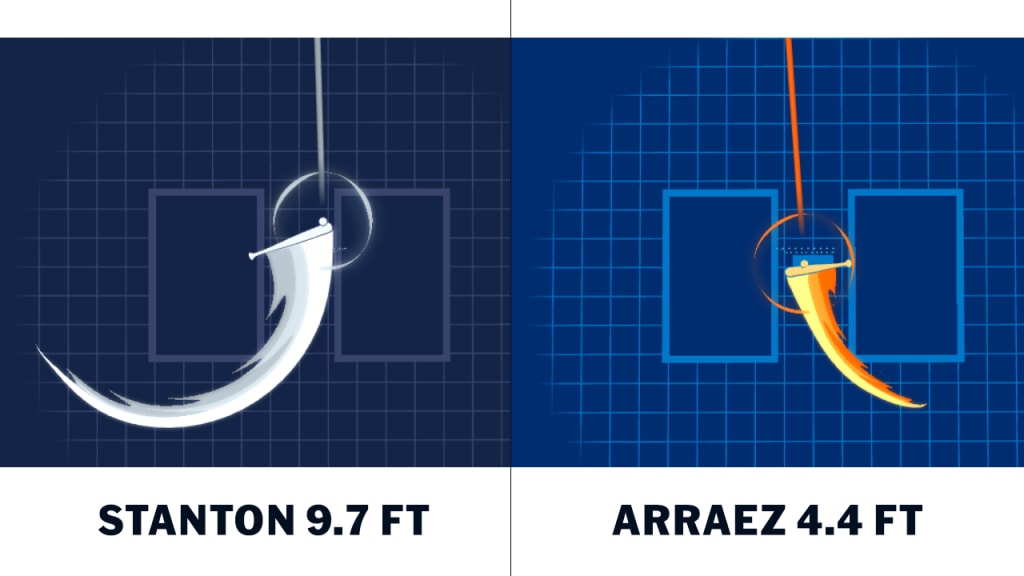
That’s a difference of nearly six feet, which is huge; looking at the top and bottom of the leaderboard, this one is satisfying because it’s exactly the names you want it to be. Of course Javier Báez and Stanton have long swings. Of course Arraez, Kwan and other contact-first hitters are quick to the ball.
Unlike some of our other metrics, however, this one’s not as clear as “good” and “bad.” It’s more about a difference in style, in whether you’re trying to get power or contact, as you can see if you take our average of 7.3 feet, and split into longer and shorter from there.
Shorter-than-average swings
- .258 BA / .359 SLG / .268 wOBA / 19% whiff rate
Longer-than-average swings
- .235 BA / .422 SLG / .282 wOBA / 30% whiff rate
As expected, shorter swings make more contact and have a higher batting average. As expected, longer swings have the trade-off of having more power and more strikeouts. It’s not better or worse. It’s just style.
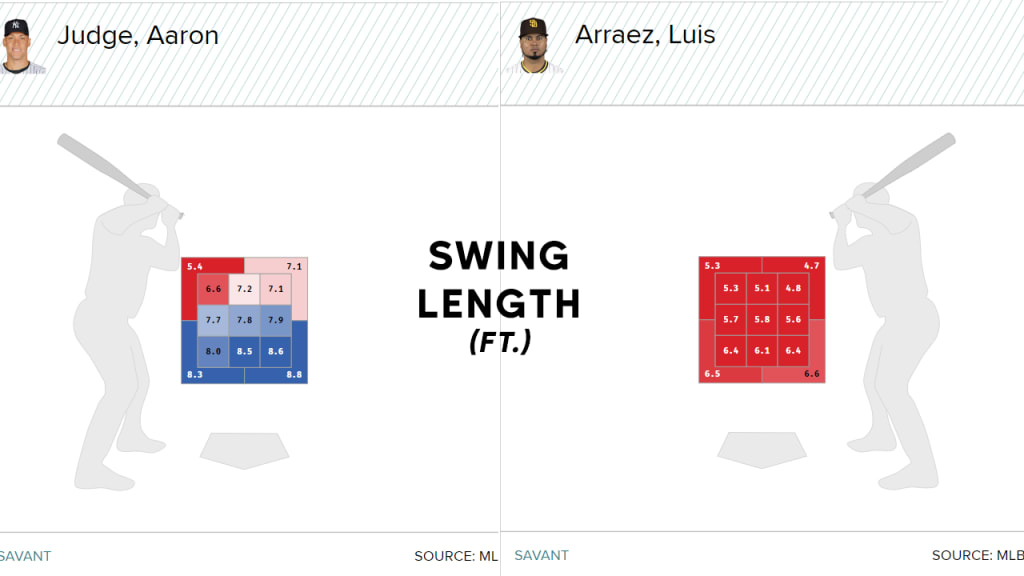
Of course, that doesn’t mean we can’t find some interesting trends. For example, does Aaron Judge shorten his swing on pitches up and in? Sure, most hitters do -- other than Arraez, who is clearly not "most" hitters.
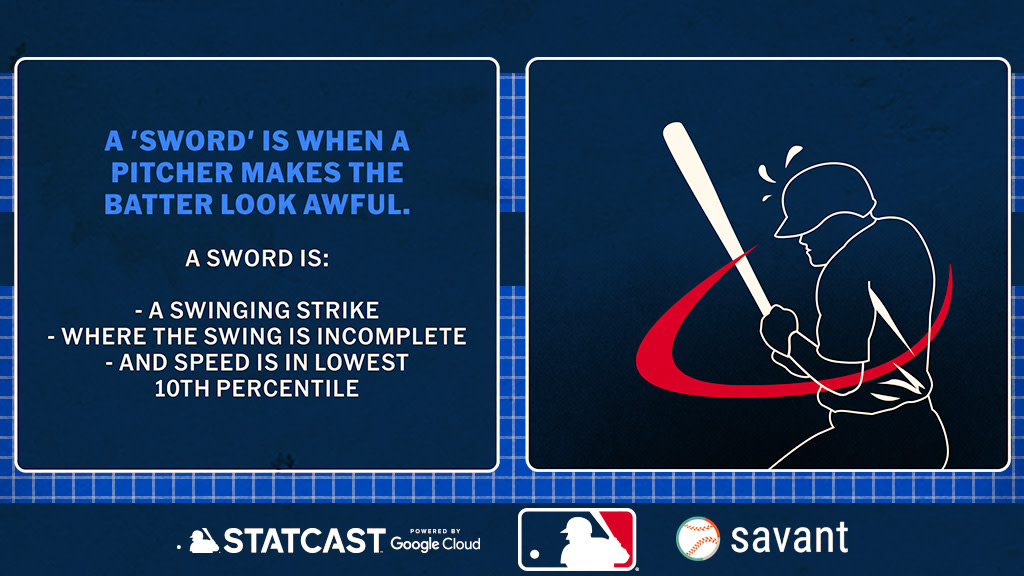
- Swords
As we explained in great detail in January, a sword is the kind of awkward, uncomfortable swing that a pitcher can only dream of, and that a batter lives in fear of getting caught on video doing -- or just like what Pirates phenom Jared Jones did to Milwaukee’s Brice Turang last month.
Right now, Luis Severino and Chris Sale are tied atop the leaderboard at nine apiece, with a number of pitchers tied at eight behind them. A sword might be a good way to talk about deception, or stuff, or the ability to make a highly-talented Major League hitter look like, well, that. It might also just be a great way to find the most fun pitching highlights, too.
The new bat tracking-leaderboards are available at Baseball Savant, updated daily.
This article has been updated from a previous version originally posted in 2022.