

Earlier this month, Statcast rolled out Outs Above Average for infielders, which, as we detailed in the introductory article, attempts to evaluate the defensive quality of infielders based on more than the eye test. Using the hardware installed at each of the 30 Major League parks, we can look at how far the infielder had to go, how much time he had to get there, how long the throw was, how fast the runner was, etc., and see how difficult each opportunity was expected to be. (Read more about how this works.)
Though there's a variety of interesting and brand-new uses for the metric, particularly in terms of evaluating shifting and positioning, for many fans, there's a pretty clear top-level interest, which is best summarized as such: Compared to existing defensive metrics like Ultimate Zone Rating or Defensive Runs Saved, did you just make my favorite guy look better or worse? If so, what's behind that?
In some cases: No! Stud defenders like Matt Chapman and Andrelton Simmons are star fielders who are going to rate well by any standard you choose. Others, like Vladimir Guerrero Jr., probably won't. There's a decent amount of overlap between the various numbers, as you'd expect. But there's definitely a handful of interesting cases where OAA grades a fielder as being better or worse than other metrics do. And that's what we're trying to get to, because we saw a bunch of questions like this:
So, let's do that for four interesting infielders.
Now, complicating matters is that we're not really doing apples-to-apples here. That is, UZR tends to eliminate shifted plays entirely, which are hundreds of thousands of pitches per year. The DRS that is generally referred to on FanGraphs and Baseball-Reference is in the process of being replaced by an updated version that accounts for shifts and positioning in a way that massively changes some players' numbers -- except that it's currently only available on FieldingBible.com. And "runs" (which DRS reports in) and "outs" (which OAA uses) aren't really the same thing. The world of defensive metrics, as always, is something of a moving target.
Anyway, it's not about "right or wrong" so much as it is about "different methodologies on different samples." Let's find some notable differences.
-1 OAA / -9 DRS (old) / -12 DRS (new) / -9.1 UZR
Might as well start with the fielder who had the most errors in baseball (26) in 2019, and who has the most errors in baseball by far (88, with no one else having more than 68) in the four seasons since his debut. DRS and UZR each think very little of Anderson. OAA has him as being basically average. How's that?
Well, part of it is about difficulty. If we look at the 37 shortstops with 100 chances assigned to them, Anderson's success rate of 85 percent isn't terribly high; it's actually tied for fourth worst. (Simmons, by comparison, had a 93 percent success rate.) He did, after all, make a lot of miscues. But what saves Anderson here somewhat is that his chances were unduly difficult. Based on the difficulty of each of his plays, he was only expected to have an 85 percent success rate, and that's tied for second hardest.
That's a good way to get to average: Doing exactly what's expected, based on the difficulty of the plays. As to why they were so hard? Well, that could be a number of things -- poor positioning, a below-average pitching staff that didn't limit hard contact or just simple bad batted-ball luck. Perhaps it's a combination of all of them.
For example, take this Luis Rengifo ball from August. Anderson throws the ball away, and it doesn't look good. But this doesn't really hurt his OAA very much either way, because this was considered a difficult play -- one made for an out only 30 percent of the time. Making mistakes matters, but so does knowing how hard the plays were in the first place.
+12 OAA / -4 DRS (old) / +6 DRS (new) / -1.6 UZR
While the Reds have been active in adding Mike Moustakas and Shogo Akiyama this winter, the one thing they haven't done is add a shortstop, which is why trade rumors connecting them to Francisco Lindor and Corey Seager have been so pervasive. Surely, they'd be better off with either of those two stars. But what if they see something in Galvis' defense that makes them comfortable standing pat?
At +12 OAA, Galvis tied with last year's Cincinnati shortstop, José Iglesias, as the sixth-best defensive shortstop. (Surely, few will argue with names like Javier Báez, Andrelton Simmons and Nick Ahmed in the group above him.) That's a big change from the old DRS and UZR, which saw him as a negative, and is still twice as much as the credit that the new DRS will give him. This has been a constant; he was +6 in 2018, and +12 in 2019.
While we can't directly look into the other systems to compare, we can share what makes Galvis look so strong in OAA. In his case, it's not necessarily due to "making great plays" so much as it is "not making very many mistakes." Let's bring back the list that we made when looking into why San Diego's Fernando Tatís Jr. rated so surprisingly poorly, which is showing misplays of opportunities with an estimated success rate of 50 percent or higher -- that is, on balls that more often than not turn into outs.
We didn't include Galvis on there, but perhaps we should have. In 1,168 innings (combining second base and shortstop), he made 16 of these high-probability misplays. (Here's what a non-error one of those looked like.) That's one every 73 innings, which is to say, he was nearly Simmons-esque in his ability to avoid mistakes. In the world of infield defense, that's often more important than making the incredible play.
Media members in Philadelphia, where Galvis spent the first six years of his career, seem to agree:
-3 OAA / -21 DRS (old) / -14 DRS (new) / +1.1 UZR
Bogaerts was rated as the weakest non-catching fielder in baseball in 2019, by the current DRS, and while the update will help him somewhat, it's still going to have him as the weakest shortstop. Meanwhile, OAA has him as only slightly below average, which is about where he's been the previous two years (-3 in 2017, +2 in '18) and will surely make Red Sox fans happier.
That's not the same thing as saying he's strong, because a -3 is not really what you strive for. We can explain part of this quickly. Though he was exclusively a shortstop, he was -5 on the left side and +2 while shifted to the right side of second base. (Just look at this nice play up the middle while blowing a bubble.) In fact, "up the middle" seems to be a strength, because he was +3 against all lefties and -6 against all righties. The current version of DRS tends to ignore the shifted plays, though the new one will account for it, hence his improvement.
So that's some of it. The rest of it is that he was just, well ... average. If you go back to the chart above in the Galvis section, you'll see he made one of those high-probability misplays once every five games or so, which is about average. If you care about errors, he made 13, which is almost exactly average for a shortstop. He was expected to make 88 percent of the chances he had, and he made 87 percent of them. There doesn't appear to be any great secret here. It's somewhat hard to believe he's a near-unplayable fielder.
-2 OAA / +8 DRS (old) / +11 DRS (new) / +2.2 UZR
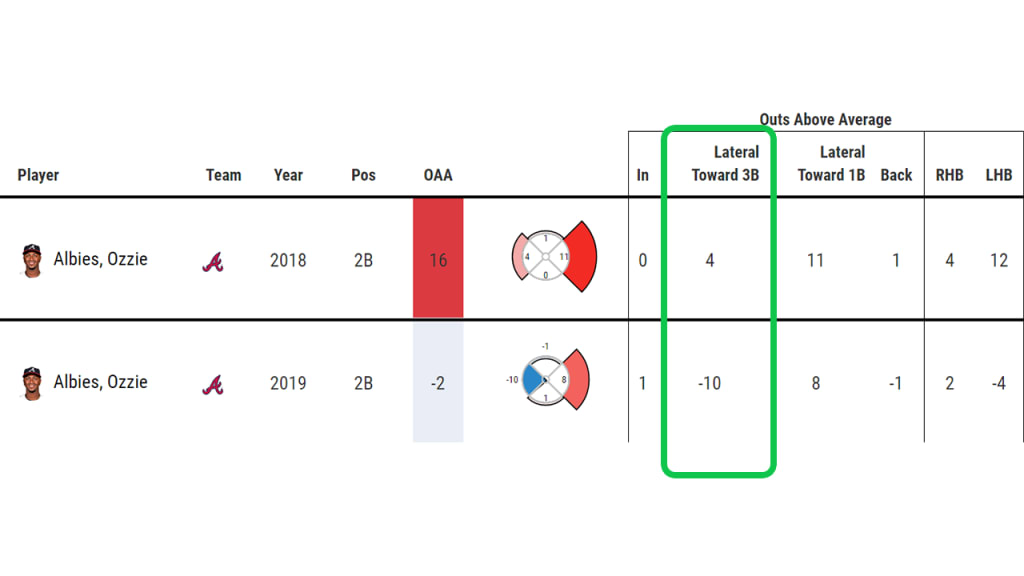
Let's go the other direction here, because each other metric has Albies as a plus, except for OAA, and even OAA had liked Albies in 2018, grading him as a stellar +16. How did he drop that far, by 18 outs, at least in our metric?
One way to look at it is to break down the plays assigned to him. Fortunately, over the last two seasons, he was considered to be responsible for almost the exact same number of batted balls -- 422 in 2018, and 432 in '19. Now, look at how those in our database break down into plays made and not made:
2018 -- 382 outs / 35 hits / 5 errors
2019 -- 366 outs / 62 hits / 4 errors
Right there, you can see the issue. He had 16 fewer plays turn into outs. (Those missed plays dropped him from +34 on outs to +28, so that explains six of the missing 18 outs.) He then had nearly twice as many balls getting past him for hits. (Those missed plays dropped him from -13 on hits to -26, which, when including errors, explains the remainder of the missing 18 outs.) Basically: More chances, fewer plays made.
That answers the question of why the metric doesn't grade him as well, but it doesn't really explain why he got to fewer balls. It seems to be a directional issue, because he was about equally as good in both years going to his glove side, but in 2019, he dropped from +4 to his arm side down to -10. That's a huge gap.
It's not quite clear why that happened, but this ball he failed to collect off the bat of Daniel Descalso is a good example of it:
You can see some of this effect just looking at something simple like "batting average against on grounders." In 2018, the Braves allowed a .226 mark on ground balls, the third best in baseball. In '19, despite adding Josh Donaldson, who rated as one of baseball's better-fielding third basemen, that jumped all the way up to .257 -- the fourth highest.
Because shortstop Dansby Swanson and first baseman Freddie Freeman stayed relatively consistent from 2018 to '19, all of those extra hits had to come from somewhere, and it seems like that they mostly came from the second-base position. That's not the same thing as predicting it will happen again in 2020, of course. But that does seem to be what happened last year.