

How best to describe how astonishingly good the best-in-baseball lineup of the best-in-baseball Braves is?
There are so, so many ways to do this. Let’s start simply, shall we? (All stats in this article are through Monday's games.)
The Braves lead the Majors in home runs by 32 over the second-place Dodgers. They’re second best in batting average and on-base percentage and best in slugging percentage, but more importantly, they have the best OPS (as well as leading in the similar but slightly more advanced cousin of OPS, wOBA).
Do you like hot starts? The Braves don't just lead the Majors in first-inning runs (110); they have more than three times what the 30th-ranked Mets do (36).
Or, maybe you prefer something more modern. They have the best hard-hit rate, as measured by Statcast, and the highest exit velocity and best barrel rate, too. (Actually, they have the best hard-hit rate of any team season, dating back to Statcast coming online in 2015.) No team swings at more pitches in the zone; no team goes to the opposite field less often. They’ve done all that while cutting down their strikeout rate, too, from last year (third highest) to this year (23rd highest). There’s just so much to like here.
But there’s something a whole lot more fun happening than just all that, and it’s at the bottom of the lineup. Atlanta’s No. 9 hitters -- at the start of the season a daily rotation, but since late May primarily Michael Harris II -- have an .812 OPS so far. That’s not just the best of any team’s final-spot hitters, though it’s that, too. It’s better than 20 of the other 29 teams’ leadoff hitters. The Braves are getting more production out of No. 9 than two-thirds of baseball are out of No. 1, and now you see what’s going on here.
The Braves aren't just strong at the top, or in the middle. They're strong at the bottom, too. They're baseball's deepest lineup -- and there's more to that than you might think.
Sure, there are stars; there always are. Ronald Acuña Jr. is the presumptive NL Most Valuable Player, and Matt Olson, who leads the league in home runs, RBIs and slugging percentage, probably finishes in the top five as well at the end of the season. Depending on how you choose to define labels such as "stars," perhaps you’d include Sean Murphy or Austin Riley or Ozzie Albies in that category as well. They're not short on big names.
Yet if a handful of stars were enough to get you to the playoffs, well, we’d have seen a lot more of the Angels in October over the past decade. What the Braves have this year is depth; what they’ve managed to put together is a lineup that simply does not give away plate appearances. When everyone wondered how on earth they'd replace Dansby Swanson, they simply turned Orlando Arcia into the NL's starting shortstop in the All-Star Game.
It’s not just about 2023, either. It's time to open the history books.
What makes for a deep lineup?
There’s not one rulebook way to do this, of course. An oft-used method is to simply look at “teams with the most above-average hitters,” and while the Braves do indeed have that -- with nine, minimum 100 plate appearances, Atlanta is tied for third most -- the play-every-day nature of the Braves' lineup means that this doesn’t really tell the story. Acuña, Olson, Albies and Riley have each started every single game of the season so far, and it’s hard to pile up “lots of above-average players” when you just don’t need that many players.
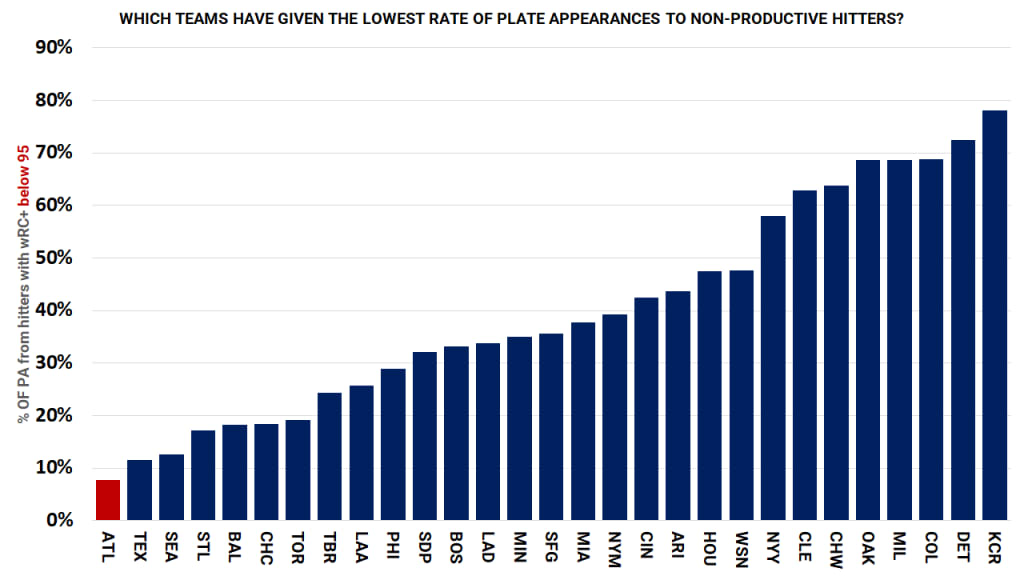
Instead, we need to look at each plate appearance, and simply ask: How many were given to batters not within shouting distance of being average hitters? "Average" is not a bad thing, especially when we're talking about the bottom part of the lineup; there are more than a few teams that would be greatly improved just by getting to "average" in a lot of ways.
Being close to average is valuable too, so for this, we'll look at FanGraphs' Weighted Runs Created Plus (wRC+), which sets 100 as league average, and we'll call batters with at least a 95 wRC+ productive hitters, in part because that's where Eddie Rosario is as of Tuesday, and a likely 20-homer season from a platoon outfielder who hits seventh isn't something we consider to be a problem. If he’s your 11th-best hitter, as he is this year for Atlanta, things are going great.
So if we set that as the line, and we look at all AL/NL teams since the start of the Live Ball Era in 1920, here's what we find. Just a single team gave a lower share of plate appearances to those non-productive hitters than the '23 Braves have so far, and you might remember the team at the top for "starting 35-5, winning 104 games and breezing to a World Series title."
Lowest rate of plate appearances by non-productive hitters, since 1920
- 5% // Tigers, 1984
- 8% // Braves, 2023
- 10% // Red Sox, 2003
- 10% // Cubs, 1937
- 10% // Orioles, 1985
That’s … it. More than nine times out of every 10 trips to the plate, the Braves are sending up someone who has been, at worst, only ever so slightly below average. There are just no black holes here -- and when you’re atop a list that includes the ‘84 Tigers and ‘03 Red Sox, that’s nice company to keep.
(What, you don’t remember the ’37 Cubs or ’85 O’s? The Cubs had five position player All-Stars and scored the most runs in the NL that year while winning 93 games, while Cal Ripken Jr.’s Orioles scored the second-most runs yet were derailed by poor pitching.)
So if you want to say the Braves are one of the deepest lineups of the last century-plus, you can do it. The only somewhat-regular Braves hitter who hasn’t quite made it there is fourth outfielder Kevin Pillar (83 wRC+), who is primarily around to back up at all three spots as well as sometimes platoon in left. The rest are scattered plate appearances from little-used backups Sam Hilliard, Vaughn Grissom, Eli White, Ehire Adrianza, Braden Shewmake and Chadwick Tromp.
It’s even wilder if you look at it just in the context of baseball in 2023, where the Braves are doing this 10 times less often than baseball's lesser lineups.
There’s not a perfect line there between “good hitters” and “scoring runs,” but it’s about as strong as you’re going to get.
"I feel like it's pretty frustrating for the other pitchers," Harris told Bally Sports last month. "They get through who they think is going to do all the damage and they get down to the bottom of the lineup and we can still do a little damage. It's a pretty special lineup."
That’s right, but “do a little damage” does somewhat understate the truth. Let’s split the lineup into three groups of three. The bottom third of the Atlanta lineup -- more often than not, comprised of some combination of Rosario, Arcia, Marcell Ozuna and Harris -- has slugged .450, which is the best in baseball of any lower third.
The middle third has slugged .510. That’s also the best in baseball.
The top third has slugged .529. That’s the second best in baseball, though only slightly behind the Dodgers.
When you’re getting slug from everywhere in the lineup, you’re probably leading the game in slugging, and they are. But it’s not by a little; Atlanta is outslugging Texas, the second-best slugging team in the game by more than 30 points. They’re 85 points of slug above the league average of .413 and it’s that -- the gap between what Atlanta is doing and what everyone else is doing -- that’s so notable.
Best slugging-plus (SLG above league average) since 1920.
- 120 // Braves, 2023
- 119 // Yankees, 1927
- 115 // Red Sox, 1977
- 115 // Red Sox, 2003
- (shortened 2020 excluded)
You maybe, just maybe, have heard of the 1927 Yankees. We're not quite prepared to say the 2023 Braves are quite that legendary. Not yet. But what they're doing is no joke. They have the stars. They have the depth. They have the deepest lineup in the game.