

The 2021 Giants are the biggest surprise of the season, and there’s absolutely no shortage of reasons fueling their rise. But for our money, the most entertaining aspect of their season is this: They’re leading the Majors in home runs, which no San Francisco team has ever done.
They didn’t do it while winning three rings in five seasons a decade ago. They didn’t do it while Barry Bonds was smashing records two decades ago. They didn’t do it while Willie Mays and Willie McCovey were starring six decades ago.
Yet they’re doing it now, without a Bonds, or Mays, or McCovey, without a slugging superstar at all; 71 players have as many or more home runs as Mike Yastrzemski, leading the team with 21. (The Giants actually haven’t had a 30-homer hitter since Bonds last did it in 2004; there have been 436 30-homer seasons across the Majors since then.) Instead, they’re doing it with depth. When Austin Slater homered to lead off Thursday's game, it made him the 10th different Giant with double-digit homers, the most in baseball this year, and the most in Giants history.
But most interestingly, they’re doing it in a ballpark that has long been considered to be absolute death to hitters, Oracle Park, which over the many names it has had since opening in 2000 has been thought of as a pitcher’s dream. It’s where pitchers go to get well. It’s where batters don’t want to be traded to.
Unless, of course … that’s no longer true. It might not be.
Not that the reputation was unearned, obviously. If you look at the post-Bonds period beginning in 2008, running through the most recent full season of 2019, no offense hit fewer homers than the Giants did. But over 2020-’21, only three teams have hit more.
LaMonte Wade Jr., for example, has 11 of his 17 homers at home, and an OPS 168 points higher than on the road. Brandon Crawford has an OPS 65 points higher at home. Just look at Brandon Belt, who for so many years was swallowed up by the hard-to-reach "Triples Alley" in right-center.
Belt road, 2011-'19: .792 OPS
Belt road, 2020-'21: .829
Belt home, 2011-'19: .811 OPS
Belt home, 2020-'21: 1.057
He's been a little better on the road over the last two years than before, but not by much. He's been massively better at home.
Now: So much of all this credit has to go to the front office that assembled the roster, to the new hitting coaches who preached the importance of plate discipline, to the players who put all that information into action on the field. This is more about people than place. Oracle is not suddenly Coors.
But something fascinating has happened over the last two seasons. The Giants offense has hit much better at home, to the point that they are the second-best home hitting team in baseball. Meanwhile, they haven’t hit much better at all on the road, where they are merely the 16th-best road hitting team. It’s hard to see that and just think “the roster is deeper and improved,” though it is certainly that too.
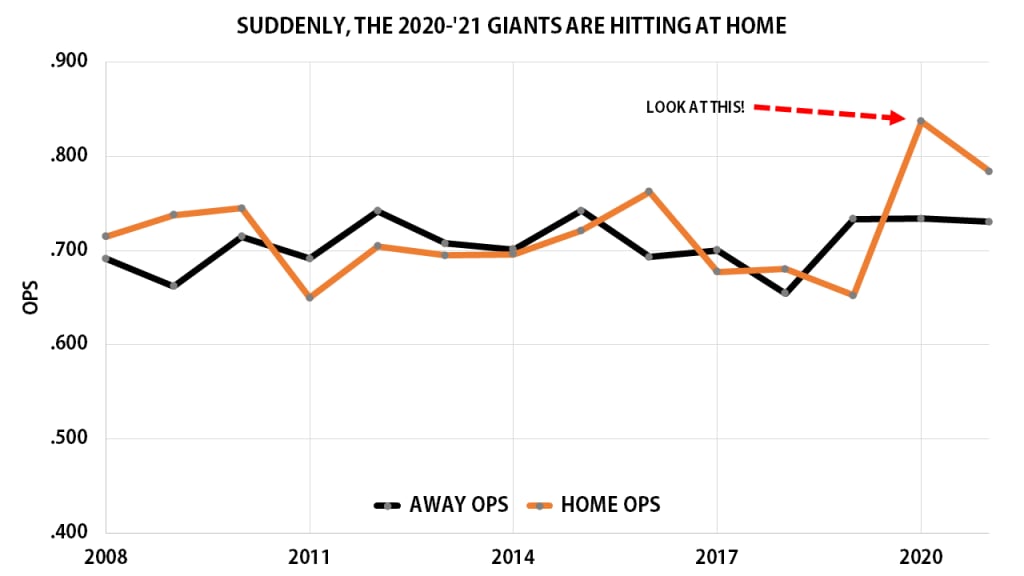
Considering that 2020 was a 60-game season, and we’re not all the way through 2021 yet, it might be tempting to regard this as a fluke, to want to wait to see what happens over the next year or two. But: We know that the team made considerable changes to the physical dimensions of the ballpark during the 2019-’20 offseason, designed to help boost offense. So maybe there’s something to this.
It’s not just looking at Giants hitters and their OPS, really. Statcast provides far more detailed park factors, which are a good way to show how different ballparks behave by comparing the performance of the same players at the park and away from the park. (So you don’t just get “Yankee Stadium is a great home run park because Aaron Judge plays there,” for example.) Generally, you want to look at these over multiple years, especially when you have things like 2020 offering a full home slate of just 30 games.
Oracle’s ranking mostly tracks with what you’d expect. From 2017-’19, it was tied with Miami for the toughest place to hit in baseball. From 2018-’20, it was the third-hardest place to hit, and from 2019-’21, it’s fifth-hardest. If that seems like “no meaningful changes, what are you talking about?” you’re right. But because of all the changes they made to the ballpark, before 2020, maybe multi-year isn’t the way to go. If we look at single-year park factors, we get this:
2019: 30th-best hitter’s park
2020: 7th-best hitter’s park (tied)
2021: 13th-best hitter’s park (tied)
There’s obviously a lot more noise in single-year numbers, especially for a pair of incomplete seasons, and yet, those rankings, combined with that OPS chart, combined with what we know about the park changes, well, it’s all hard to ignore. But: why?
What really changed at Oracle?
As written at the time, this is what they did to the park:
The Giants announced new dimensions for Oracle Park's outfield on Thursday as part of their plan to revamp the park for the 2020 season, which includes relocating the bullpens from foul territory to their new home behind the center-field wall.
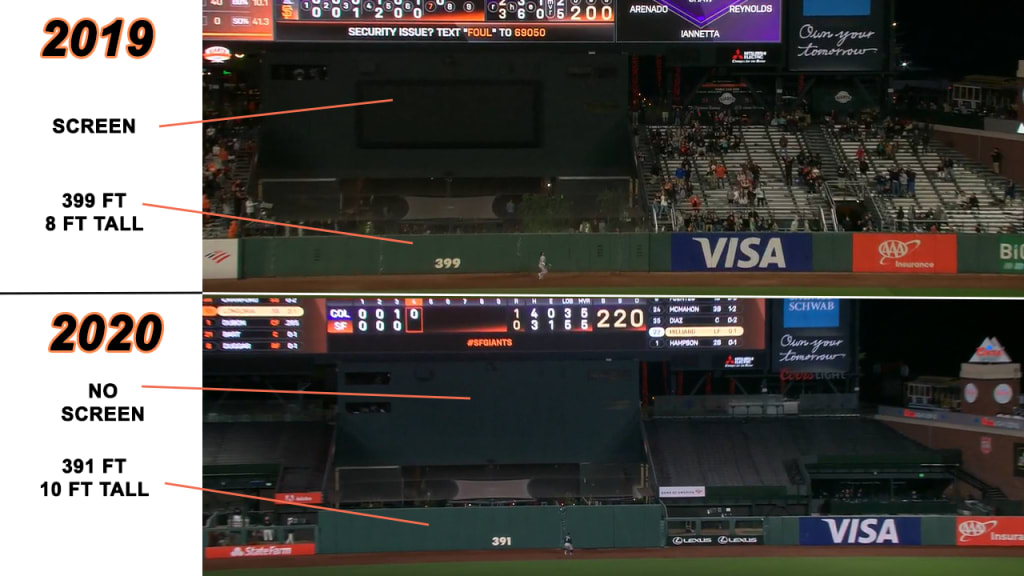
Left-center field will move from 404 feet to 399 feet, center field will move from 399 feet to 391 feet, and "Triples Alley" in right-center field will move from 421 feet to 415 feet. The new center-field wall will be seven feet high instead of eight.
The 391-foot distance to center field now makes it the second-shortest center field in baseball. But that’s not the entirety of it, either. Despite the initial announcement that the center-field wall would drop from eight feet to seven, it was raised up to 10 feet just before Opening Day in 2020. Hold that thought for a second.
Now, whenever a team changes the height or distance of walls, the immediate thought is: home runs. That’s sometimes overstated; after all, hitting a ball 415 feet is still 98.6% of the distance of hitting it 421 feet. It’s still hard, just slightly less hard. But we did see more dingers in San Francisco, anyway.
From 2017-’19, Oracle saw the 30th-most (i.e., fewest) homers, by a full 66 behind Miami. In 2020-’21, that number rose to 17th. We’re counting all homers hit in the park, both by and against the Giants, so it’s not just about the improved offense, and if “17th” isn’t some launching pad, well, it’s not 30th, either.
For example, this home run from Belt on Tuesday night almost certainly would not have been out of the park prior to 2020, according to Statcast tracking.
Nor this one by Thairo Estrada in July:
Nor, in the interest of showing how this affects Giants pitching as well as their hitting, this one allowed by Kevin Gausman.
There are, all told, about three dozen homers that the new dimensions of the park created over the last two seasons.
But it’s not all about home runs, either. Park factors rarely are.
For example, there’s foul ball territory. Part of the park renovations included adding an extra row of seats where the bullpens had been down the lines, cutting down on about four feet of foul territory on both sides. Less foul territory means fewer foul outs, and that’s played out in the numbers. This change only happened prior to 2021, not ‘20, and this year, no park has had fewer foul outs than Oracle has. From 2017-’20, there were seven parks that had fewer.
So that’s helpful to hitters, and, we’ll argue perhaps counterintuitively, that the extra wall height in center might be too. Sure, it helps to have walls that are 1% closer than they used to be. But the best thing you can do to hit a home run is to hit the ball as hard as you can. You’d think raising the height of a wall would be bad for hitters. We’ll argue that it’s actually been huge for them.
It might just be easier to make hard contact now
Let’s go back to the last-second decision to raise that center-field wall before Opening Day last year. “The Giants have the only bullpens in the Major Leagues that partially overlap into the batter’s eye, which has given some club officials mild indigestion,” wrote the Athletic on July 22, 2020, after the first exhibition game at the newly configured park. Six days later, the wall was three feet higher than it had been, which was “supposed to improve visibility for hitters.”
It wasn’t just the wall, either. There was another change, as well.
"We made an adjustment to the scoreboard, removing the lower screen,” said president of baseball operations Farhan Zaidi to NBC last October, “which our guys felt really helped the backdrop for them from a hitting standpoint.”
You can see the difference here, really quite clearly, thanks to Zaidi telling us exactly what to look for. It's not hard at all to think that the changes make it easier to pick up a white baseball.
If the worry was that the visibility wasn’t good enough for hitters, well, look at what’s happened since. There's simply more hard-hit contact happening in San Francisco.
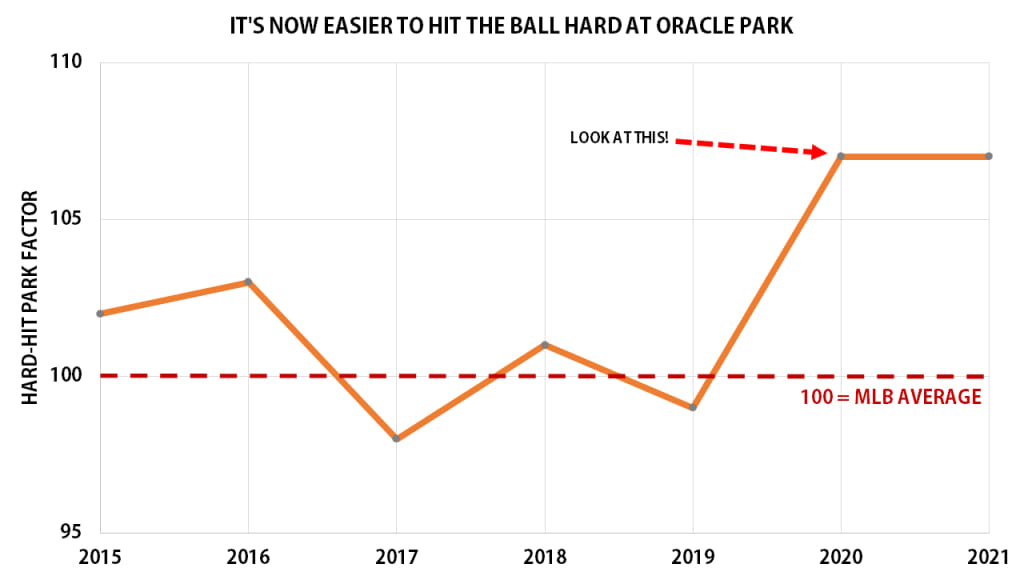
In 2017-’19, Oracle had the 17th-best hard-hit rate. In 2020-’21, the park has the fifth-best hard hit rate. Again, that’s not just about “improved lineup,” because it’s including what the pitching staff does, too; either way, the 2020-’21 Giants batters have the sixth-best home hard-hit rate but the 22nd-best road hard-hit rate.
What’s nice about measuring hard-hit rate -- simply how often a batted ball is hit with 95 mph or more of exit velocity -- is it’s entirely about the moment of batted ball contact. It doesn’t have anything to do with how the ball carries, or how far the fences are, or any of the other things you typically associate with a park factor. When the center-field fence was raised to increase visibility, it seems like it might have done exactly that.
“It’s not as much the ballpark playing well, it’s our guys hitting well,” outfielder Alex Dickerson told KNBR in June. “I’ve been saying that the last two years. You guys have been making up a bunch of stuff about putting a tarp up and it’s traveling better. We’re hitting the ball much harder.”
He is, mostly, right, though of course he’d prefer to give credit to the good work of his teammates than an external factor.
But that part has come up a lot, that the ball is carrying differently. Is it?
It’s an extremely difficult thing to account for, especially in a place like San Francisco where the weather isn’t exactly consistent from day to night, nor the park itself from year to year. We know that in 2019, they more than tripled the size of the scoreboard in center field. We also know that starting in 2020, the right-field archways were blocked off, which may or may not have changed the wind patterns.
There’s certainly plenty of anecdotal evidence, anyway. “It affects the carry to right-center and center,” said Mike Krukow on KNBR. “So now we have a much more home run friendly ballpark than we’ve ever seen.”
Krukow’s opinion carries weight; he pitched for the team when it called Candlestick home from 1983-’89, and he’s been a full-time broadcaster for the club since 1994. But it might also be hard, with the eyeball test, to separate “the ball is carrying better” from “the ball is being hit harder.”
The numbers say: Yes. Kind of. Go back to the Statcast park factors one more time, and you can see how well a ball carries in a particular park compared to other parks, in terms of “extra feet.” (All on an apples-to-apples basis, in the sense that no one cares how far a grounder carries. It’s comparing pulled balls hit in a particular blast-zone window of exit velocity and launch angle.)
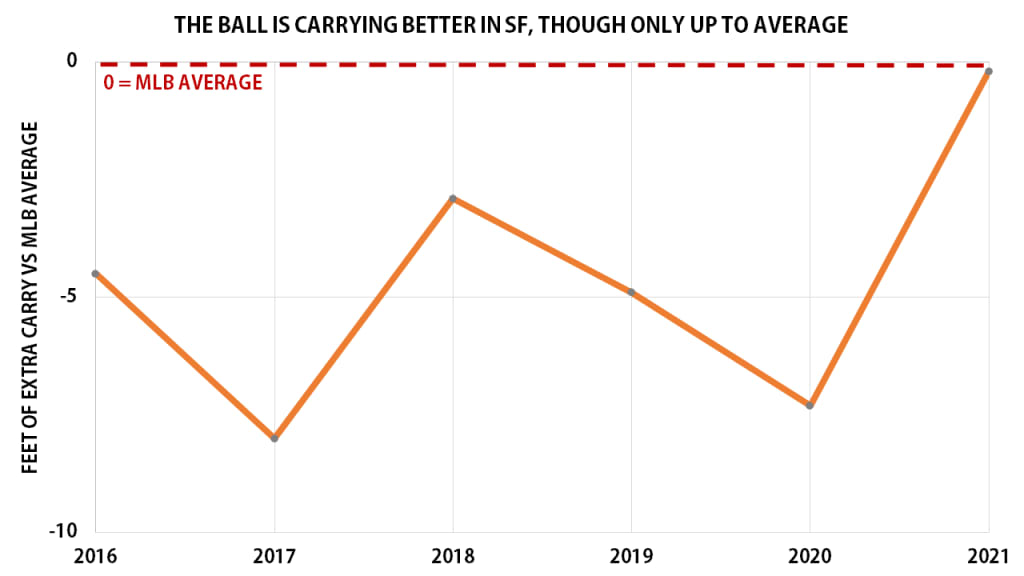
From 2016-’20, Oracle Park rated poorly each year, costing hitters between 4 and 8 feet per season compared to other parks. It was 25th in 2016, 30th in 2017, 23rd in 2018, 29th in 2019, and 30th again in 2020.
It’s tied for 13th in 2021, and the number has gone from last year’s “minus-7.3 feet of carry” to this year’s “0,” which means … average. It’s average. The ball used to carry horribly in Oracle, worse than anywhere. Now it’s average carry. That doesn’t happen by accident (though we saw much less difference between lefty and righty hitters than we expected when we split them).
That’s both expected -- look at Krukow’s comments -- and a little surprising that it’s only showing up that way this year, not last year. Then again, last year started in the final week of July, missing the cold part of the early season, and had just 30 home dates. Maybe park factors over one-third of a season aren’t the most reliable.
It’s not, to be clear, that this is suddenly the world’s greatest home run hitting park. It’s not. On Wednesday, Wade Jr. hit a blast to right-center that garnered him a double, yet it would have been a home run in the other 29 Major League parks.
That's still going to happen, and we can't express enough that the biggest part of the Giants leading the Majors in homers is the incredible job they've done acquiring and coaching a deep group of hitters. But they're also, for once, not being held back by their home park as much. The Giants had the sport's all-time record holder in Bonds, and they never led the Majors in homers. They don't have anything of the sort in 2021, and they're on track to do it. It helps, apparently, to have your home park not be an opponent.