



Gold Glove Award season has arrived, with the 2026 winners set to be announced on ESPN on Sunday at 8:30 p.m. ET. So it's a good time to update a study we did a little more than two years ago, back in the summer of 2024, breaking down how it seemed like outfielders had become more and more dominant on defense.
With two-and-a-quarter additional seasons of ball under our belt, we’re back to tell you that the trend hasn’t stopped. It’s accelerated.
Indeed, outfielders are taking over the game, in ways never really before seen – and not just because Pete Crow-Armstrong and Ceddanne Rafaela have, in the last two years, posted three of the top six outfield seasons that Statcast has ever tracked.
There’s a very simple way to show this, and then a more complicated (and meaningful) way. Let’s do it the simple way, first.
In 12 years of Statcast tracking, and looking of course only at balls that were not home runs, 2026 featured …
- The lowest batting average on balls hit 220 feet or more (.292)
- The second-lowest batting average on hard-hit balls (.418), behind only 2025
- The second-lowest batting average on barreled balls (.435), behind only 2025
This isn’t about strikeouts, because of course this only matters after good contact is made. It’s mostly not about grounders, because while a hard-hit ball can be a grounder, a barreled ball – or one that goes more than 220 feet – mostly can’t.
It’s about the fact that it’s never been harder than it is right now to find a base hit in the outfield grass. It’s an underappreciated part of the never-ending cat-and-mouse game of offense and defense. It’s not just the pitchers, and it’s not just the hitters. It’s the fielders, too, specifically the outfielders.
Maybe that’s enough. Those simple numbers are compelling. Yet we can do better. Let’s go the more complicated route to tell the same story.
The way most defensive metrics work, like Statcast’s Outs Above Average, is to look at not only whether the play was made, but how difficult the chance was. That's primarily (but not exclusively) based on the distance a fielder had to go, and the time he had to get there. When you see a particular play that has, let’s say, a 40% Catch Probability, it means that across all similar opportunities in that season, outfielders turn that chance into an out only four times in 10.
The “in that season” part is key, because the way most advanced metrics work is to set “average” as “average for that year.” That’s how things like OPS+ or ERA+ work, and it’s how things like framing runs or OAA work. The MLB average for each season comes back to 0, where positive value is above and negative value is below.
So, when Crow-Armstrong makes his latest incredible play, the skill he showed in doing so is compared to his contemporaries of the same season, to put it on somewhat of a level playing field.
What we’re about to show you is: What if it didn’t work that way?
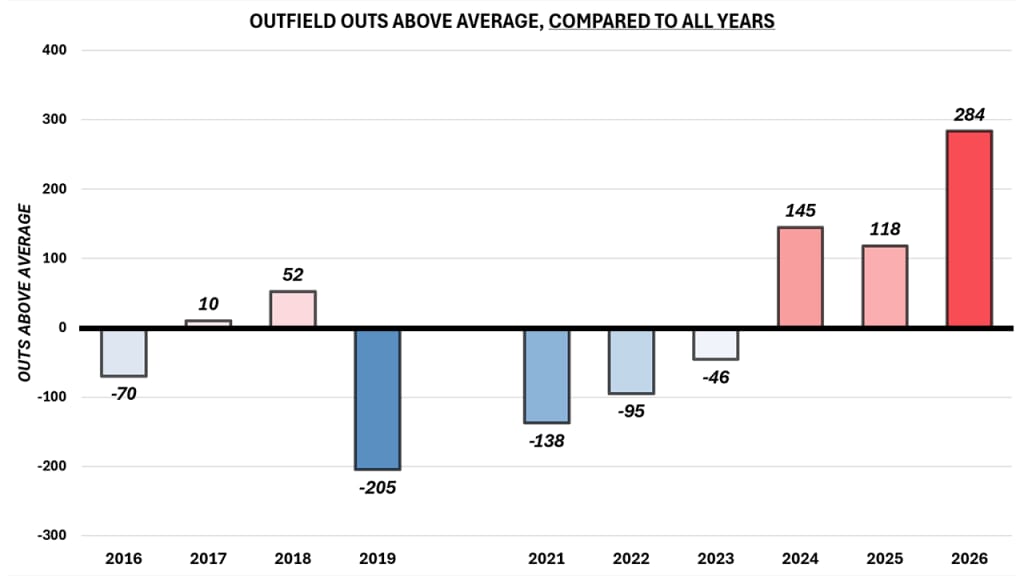
Thanks to MLB’s senior data architect, Tom Tango, we took outfielder Outs Above Average (which is the ‘catching the ball’ part of the primary Fielding Run Value metric, so excluding the value added by throwing arms), and put it on a scale so that it’s compared to every play of the entire Statcast tracking era, not just this season.
This way, we’re saying that Crow-Armstrong isn’t just being compared to the likes of 2026 stars like Rafaela and Andy Pages, but also to the opportunities players like Charlie Blackmon, Matt Kemp, and Carlos Beltrán saw years ago.
That allows us to compare not just within one year, but across many years, and the results are … stunning.
In 2026, compared only to this season, the average Outs Above Average was 0, because it has to be. That’s the case every year: the average is ‘0’, for that year, and you can be above (like Rafaela was, at +17) or below (like Kyle Tucker was, at -8).
But if we’re comparing to the entire tracking era, then in 2026, Major League outfielders compiled +284 Outs Above Average. In the last three seasons alone, it’s been nearly 550 Outs Above Average, after being nearly 500 below average in the full seasons before that.
Think about it this way: Jordan Hicks averaging 99.2 mph on his fastballs this year was cool, but hardly something songs will be sung for, as that doesn’t even get him into the top 10. Yet a generation ago, that kind of heat would have been incredible, and might have made him an All-Star closer with a cool nickname. As the game changes, context does too.
So, take the Rays outfield, for example, which (including the postseason) had +40 Outs Above Average, the best single-season outfield on record. That’s comparing them to the rest of 2026 outfields, but compared to the outfields of the last decade, they’re even better than that; they’d land at +48 Outs Above Average. It’s not that they did anything different. It’s that the average becomes different.
Take the simple way, and the advanced way, and they’re each telling the same story: Outfielders are better than they’ve really ever been at taking batted balls and turning them into outs.
The real question, then: How is that happening? What’s getting fielders to more balls, more effectively? We’ve got three clear premises here.
1) Speed and youth
This is it, and has been for some time. Sprint speed is measured in feet per second, and the short-hand has long been that 27 ft/sec is average, and 30 ft/sec is elite.
Way back in 2015, there were 37 players who topped 29 ft/sec. By 2021, it was 46. This year, it was 63. Someone like Fernando Tatis Jr., who finished tied for 56th this year at 29 ft/sec, would have been tied for 31st a decade ago.
What that means is that the average itself has meaningfully moved, too. Consider the percentage of qualified players who had a seasonal sprint speed above 27 ft/sec, over the years. A decade ago, it was just a touch over 50%, which is why that mark became the shorthand for ‘average.’ In 2026, it was above 70%.
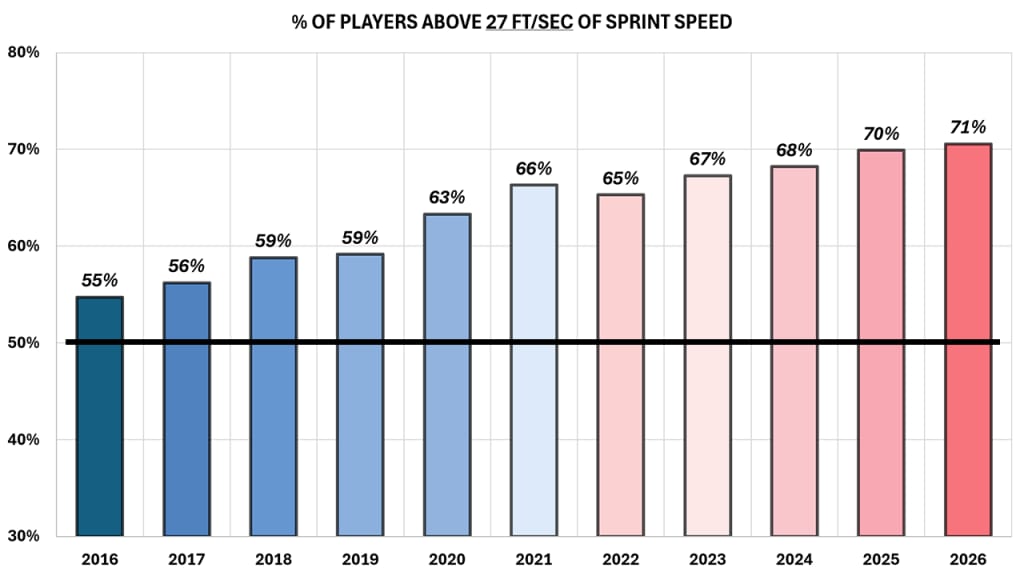
If we update some numbers we had back in 2024 to show the weighted average at the three outfield spots, comparing 2016 to 2026, it’s clear what’s happened.
Outfield ft/sec, 2016->2026
- LF: 27.5 -> 28.0 (+0.5)
- CF: 28.3 -> 28.7 (+0.4)
- RF: 27.4 -> 28.0 (+0.6)
How do you get faster? Maybe you focus on acquiring players with that skill but maybe, too, it’s simply about having younger players. Remember that we just finished a season in which the Nationals not only did not give a single plate appearance to a position player older than 28, but that along with the Marlins and Cardinals, each of the three teams in history with the most PA given to ‘young’ players happened this year.
That’s especially been the case in the outfield. In 2026, 76% of outfield plate appearances came from players 29 or younger, the highest mark of the 2008-’26 pitch tracking era, and up from 65% a decade ago. Specific to center fielders, that’s 82%, up from 70% a decade ago. Just two center fielders 32 or older got 250 or more plate appearances, and both of them (Mike Trout and Byron Buxton) have been doing this for a very long time. Between 2004-09, to pick one span, there were at least four such older center fielders every year, and 2004 actually had nine.
Catching the ball is a math problem: Can you cover X feet in Y seconds to get there? Younger, faster players help close that gap. So does our next reason ...
2) Emphasis on coaching
It’s difficult, if not nearly impossible, to teach players to simply run faster. But what increasingly seems to be happening is that you can teach players how to get off to good jumps. That's what actually makes a massive difference in the rate of plays made – far more than running clean routes.
We talked about this in great detail with the 2026 Rays, who took Chandler Simpson and Cedric Mullins and markedly improved their reactions. They also promoted Victor Mesa Jr., who in a small sample had some off-the-charts numbers. It appears to also be what Seiya Suzuki did in Chicago, and was part of what drew Toronto to prospect Brett Bateman when trading Kevin Gausman to the Cubs.
Prior to 2025, Miami outfield coach Blake Lalli was quite open about how he was trying to train his defenders.
“Correlation has shown that the outfielders that react the best go [and] make more plays, even if their route is a little off,” said Lalli. “We just put hyper focus on moving early and quick.”
Exactly right. As FanGraphs showed nearly four years ago now, there’s strong correlation between an outfielder's value and his reaction time (feet covered in the first 1.5 seconds). There's an even better and stronger correlation between his value and what he does in the next three seconds (the ‘burst’). Meanwhile, essentially nothing about the route taken really matters.
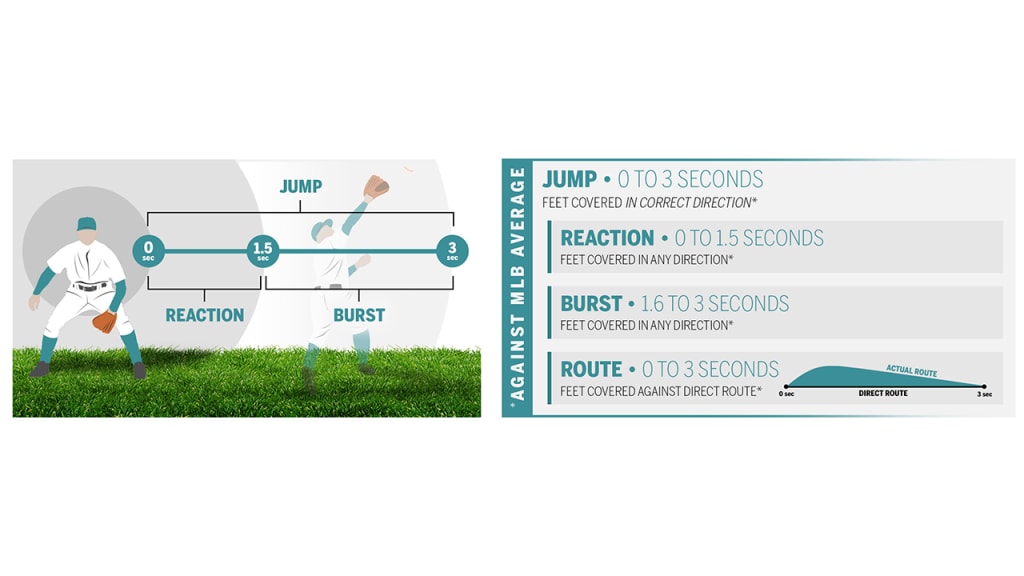
It’s stark when you look at the 2016 vs 2026 comparisons of all the components of getting a good jump.
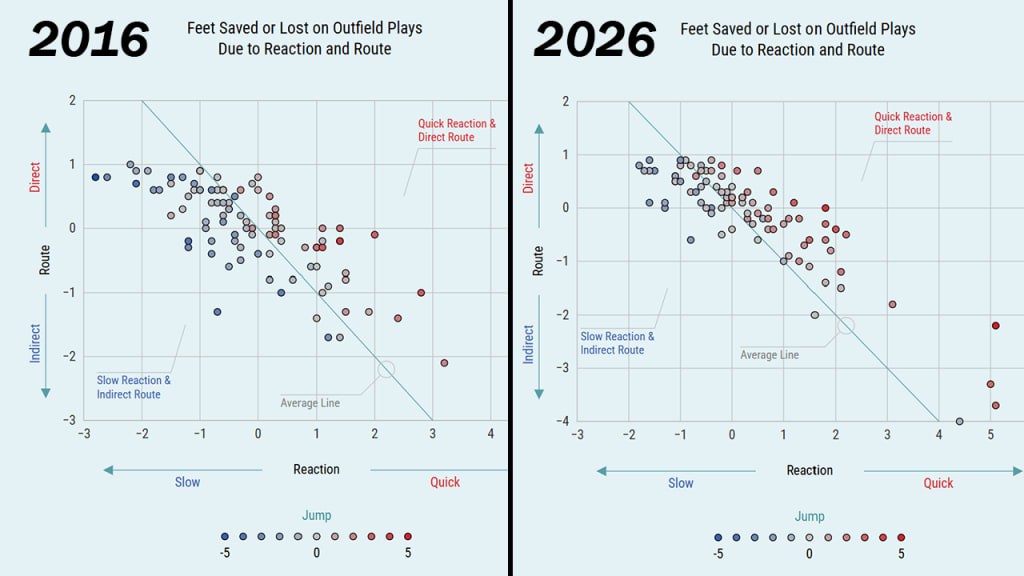
This is exactly what Kevin Kiermaier has been talking about for years, and he's merely one of the best to ever do it. If there's any teams left who aren't yet doing this, expect that to change soon.
3) Positioning
This matters, because it has to. It was an entire decade ago that we started talking about the trend of outfielders playing deeper, and that hasn’t abated; in 2026, center fielders played an average of 324 feet deep, the deepest on record and a full dozen feet deeper than 2015. We’ve all seen the positioning cards, and several other fielders get access to PitchCom beyond only the pitcher and catcher.
If you take younger, faster players, who are getting better at jumps and reactions, and you put them in better positions to succeed, well, what do you think is going to happen? More balls into gloves, that’s what.
That can be shown with the estimated out rates, based primarily on distance and time (among other reasons). Let’s break this up into chunks.
Estimated out rate, from outfielders
- 2016: .865
- 2017: .867
- 2018: .869
- 2019: .869
Takeaway there: nothing at all. Nothing changed. But then ..
- 2020: .877
- 2021: .877
- 2022: .880
- 2023: .879
- 2024: .883
- 2025: .882
- 2026: .886
It’s not huge differences, because there’s only so much juice to continue to be squeezed here. However, you can see that over the years, chances are getting a little easier, because positioning has gotten better. That there’s been an upward trend since 2021 is reassuring, too, because the tracking technology that fueled Statcast changed prior to 2020, and you wouldn’t want this to just be an outcome of a hardware change.
It’s not. It’s that the best outfield athletes we’ve seen are training to get faster and being put in the best spots to do so. This, for one, has nothing to do with strikeouts or pitchers. Even putting the ball into the outfield doesn’t get you what it once did.