

You wouldn’t think, given all he’s accomplished in the Majors over the last decade, that there wouldn’t be much left that Mike Trout could do to surprise us. (Aside from actually winning a playoff game, which he somehow still hasn’t done, and which is the greatest evidence ever of how much of a team game baseball really is.) He’s won three MVPs. He’s off to one of the best career starts in history. What’s left to prove?
Well, hold that thought for a minute. After returning from a bruised elbow by going 4-for-5 on Monday, Trout is hitting an absolutely obscene .426/.539/.820. It’s the best line in baseball. It’s the best month of his career. It’s one of the best Aprils anyone has ever had, ever. How is that even possible, that he’s still showing more? Let’s find out.
Trout is riding a streak of nine consecutive top five finishes in the MVP race. He’s 29 years old, but he’s already in the all-time Top 40 in Wins Above Replacement. By the end of the season, he’ll be in the all-time Top 3 in WAR before 30 years old. There’s a strong argument to make that when he’s finished, he’ll go down as the best player of all time.
You’d think, given those heights, the only direction left to go would be down. But instead, his month-by-month (starting with his first full season of 2012) productivity chart, using Weighted On-Base Average, looks like this:
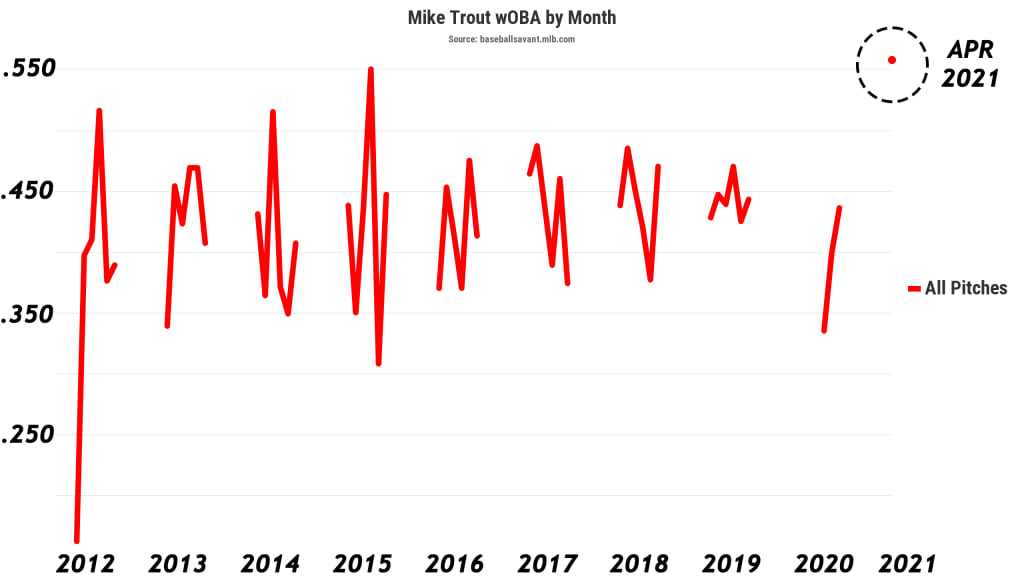
If you prefer the raw numbers, dig them this way, among all months where he’s had at least 50 plate appearances:
And so, if we flip over to OPS for a second, and look at all Aprils ever where a player had at least 75 plate appearances, you can see that Trout ranks pretty highly on a very impressive list:
1.828 -- Barry Bonds, 2004
1.449 -- Larry Walker, 1997
1.442 -- Barry Bonds, 1993
1.433 -- Ron Cey, 1977
1.428 -- Barry Bonds, 2002
1.428 -- Tony Pérez, 1970
1.423 -- Albert Pujols, 2006
1.407 -- Jason Giambi, 2006
1.397 -- Cody Bellinger, 2019
1.383 -- Matt Kemp, 2012
1.359 -- Mike Trout, 2021
That’s it. That’s quite the list. Bonds, clearly, enjoyed the starts of baseball seasons.
But then there's also this, which is perhaps counterintuitive.
• His 26.3% strikeout rate is one of his 10 highest ever. He’s making contact on 74.4% of his swings, which would be his second-lowest ever.
So all accolades aside, what is going on here? It’s fair to point out that his .571 Batting Average on Balls in Play is a wildly unsustainable number, also the best he’s ever had in any month, and cannot possibly last all season long. But this isn’t just “good luck,” either, right? Of course not. It never is when it comes to Trout. Let’s start with some obvious changes.
He’s being more aggressive.
Bear with us here, because we’re about to go on a journey. Last year, Trout said that he saw conversation on social media about why his defense had declined -- presumably it was this very thread we posted -- and that motivated him to try to work on exactly that. (In a very small sample, it seems like he has in fact improved.)
Now, we’re not going to specifically say that he saw the headline on FanGraphs last summer that read “It Is Time for Mike Trout To Be Less Patient,” but …
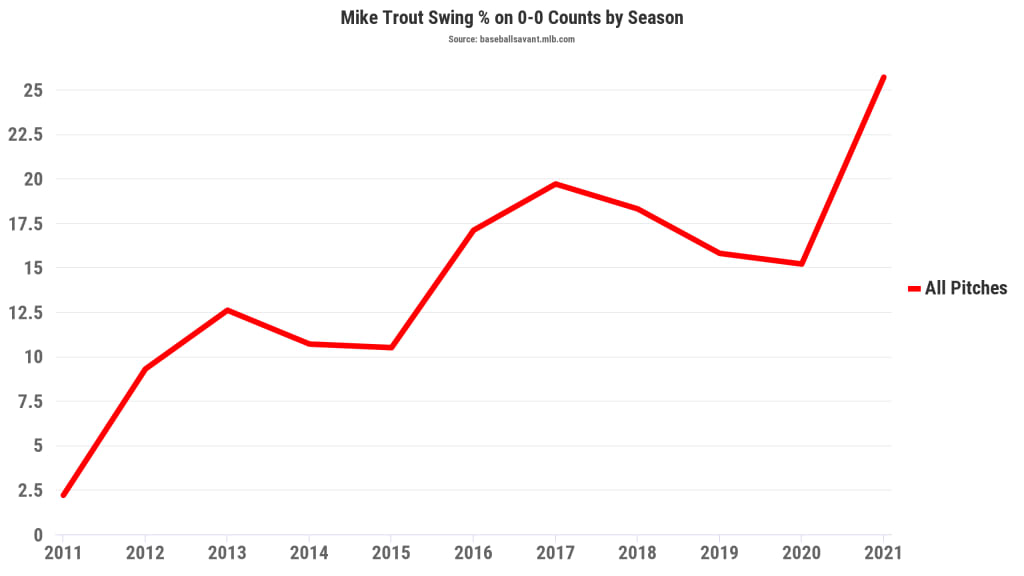
… that sure is a compelling chart. Last year, among the 309 batters who took 100 plate appearances, Trout’s first-pitch swing rate was 292nd, or in the bottom five percent. This year, among the 242 batters who have had 50 plate appearances, Trout is 147th, which is higher than 40 percent of other hitters.
“I did that in the minor leagues,” Trout told FiveThirtyEight back in 2019. “I took until I got a strike. I think that helped me understand the zone.”
No longer, apparently. In his first taste of the bigs in 2011, Trout had 135 plate appearances, and he swung at the first pitch twice. Compare that to what he did last Wednesday against the Rangers, when he went after the first pitch twice in five innings, including this opposite field homer.
This isn’t the same thing as saying he’s now Luis Robert levels of aggressive, because he’s not, and never will be. But it’s also true that last season, pitchers were so deathly afraid of getting behind in the count to the great Trout that only two hitters in the game saw more pitches in the strike zone, in part because only one hitter, Cavan Biggio, chased non-strikes less often.
Consistently, through his career, Trout has seen a fastball on the first pitch about 70 to 75% of the time. For his career, he's crushed fastballs on all counts (.318 average, .597 slugging), but especially so on the first pitch (.426 average, .836 slugging, keeping in mind that you can't strike out on the first pitch). Instead of watching some of those hittable fastballs fly by, he's doing more damage on them.
He’s hitting it harder and going opposite field less.
These are probably not terribly surprising facts -- when you’ve got an OPS north of 1.300 then yeah, you’re probably hitting it pretty hard -- but they’re worth at least quickly describing here. As we just noted, being more aggressive on those hittable pitches probably helps up your hard-hit rate (defined as percentage of batted balls hit at 95 MPH or harder). Still, it's a fascinating trend here, as Trout was always more "good-not-elite" at this.
2016 -- 42%
2017 -- 40%
2018 -- 46%
2019 -- 44%
2020 -- 55%
2021 -- 59%
From 2016 through '19, Trout was better than about 85% of other regular hitters. In 2020-'21, he's third-best, behind only Fernando Tatis Jr. and Ronald Acuña Jr. Just what pitchers needed: A version of Trout that hits the ball harder more consistently.
While the pull rate increase isn't quite as big and flashy, it's worth pointing out, because he'd pulled the ball about 37% of the time through 2020, and that's 51% this year. In and of itself, this should not matter to you, except for the fact that like most hitters, Trout has far less power going opposite field. Just look at his career hard-hit numbers:
Pull/straightaway -- 51%
Opposite field -- 30%
It's too soon to say if that's intentional or just a fluke, but what we can say with confidence is that Trout is being shifted more than he ever has, up to 56% of the time. He's not going opposite field to beat it. He's just smashing baseballs through it. It's working out pretty fine for him.
He’s done this before, sort of.
We did say above that this is going to be his best April, and that’s true. It’s going to be his best month at any point in his career, and that’s also true. But “month,” sometimes, can be limiting. As wildly great as Trout has been thus far in 2021, if we were to look at similar spans (i.e., 18-game stretches with at least 75 plate appearances in them, excluding overlapping ones) over his career, well, he’s been here before.
1.413 OPS -- 4/28 through 5/23 in 2017
1.391 OPS -- 4/17 through 5/6 in 2018
1.381 OPS -- 7/5 through 7/31 in 2015
1.359 OPS -- 4/1 through 4/26 in 2021
That’s right. Trout, hitting .426/.539/.820, has somehow had better runs, just not to start a season. He blasted nine homers in that 2017 stretch. He hit 11 in that 2015 run, including memorably hitting two homers on his mother’s birthday.
Maybe, then, we should be amazed by this but not stunned by it. Trout's had runs like this before. He'll probably have one again sometime. After all, you don't get to be [likely] a "top three player of all time through the end of your twenties" by accident.
“Once I dial it in, it should be a fun year,” Trout told CBS on Apr. 23. Imagine thinking he wasn’t already dialed in. Imagine thinking there was still another level for him to get to. Then again, imagine thinking Trout doesn't yet have the capacity to impress you even more.