
Catcher Framing
Definition
Catcher framing is the art of a catcher receiving a pitch in a way that makes it more likely for an umpire to call it a strike -- whether that's turning a borderline ball into a strike, or not losing a strike to a "ball" call due to poor framing.
The effects of a single pitch can be huge. In 2025, for example, MLB hitters had an .806 OPS after a 1-0 count, but just a .607 OPS after an 0-1 count.
Statcast's catcher framing stats measure the ability of a catcher to get called strikes on pitches received in the various regions in and around the strike zone. The value of that pitch framing is translated into the catcher's runs saved (or lost) for his team.
Catcher framing focuses primarily on the edges of the plate -- or, the "Shadow Zone," as seen in the image below -- but Statcast's framing numbers now include the impact of all of a catcher's pitches received in all zones.
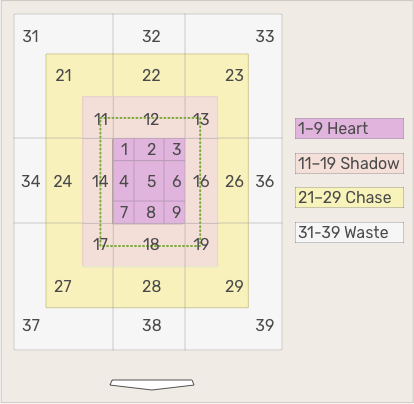
The Shadow Zone is defined as the area around the edges of the strike zone – from one baseball’s width inside the strike zone, to one baseball’s width outside the strike zone. Pitches in the Shadow Zone are borderline pitches, where the call could go either way. Depending on how well the catcher frames a pitch in the Shadow Zone, it could become either a strike or a ball.
Catcher framing leaderboard
The Statcast catcher framing leaderboard is available on Baseball Savant here.
There are two key metrics displayed:
- Shadow Strike %: This is a catcher’s called strike rate on pitches received (i.e. all batter non-swings) around the edges of the strike zone.
- Catcher Framing Runs: This is a catcher’s runs saved from gaining extra strikes. Catcher Framing Runs converts a catcher’s called strikes to runs saved on a .125 runs per strike basis.
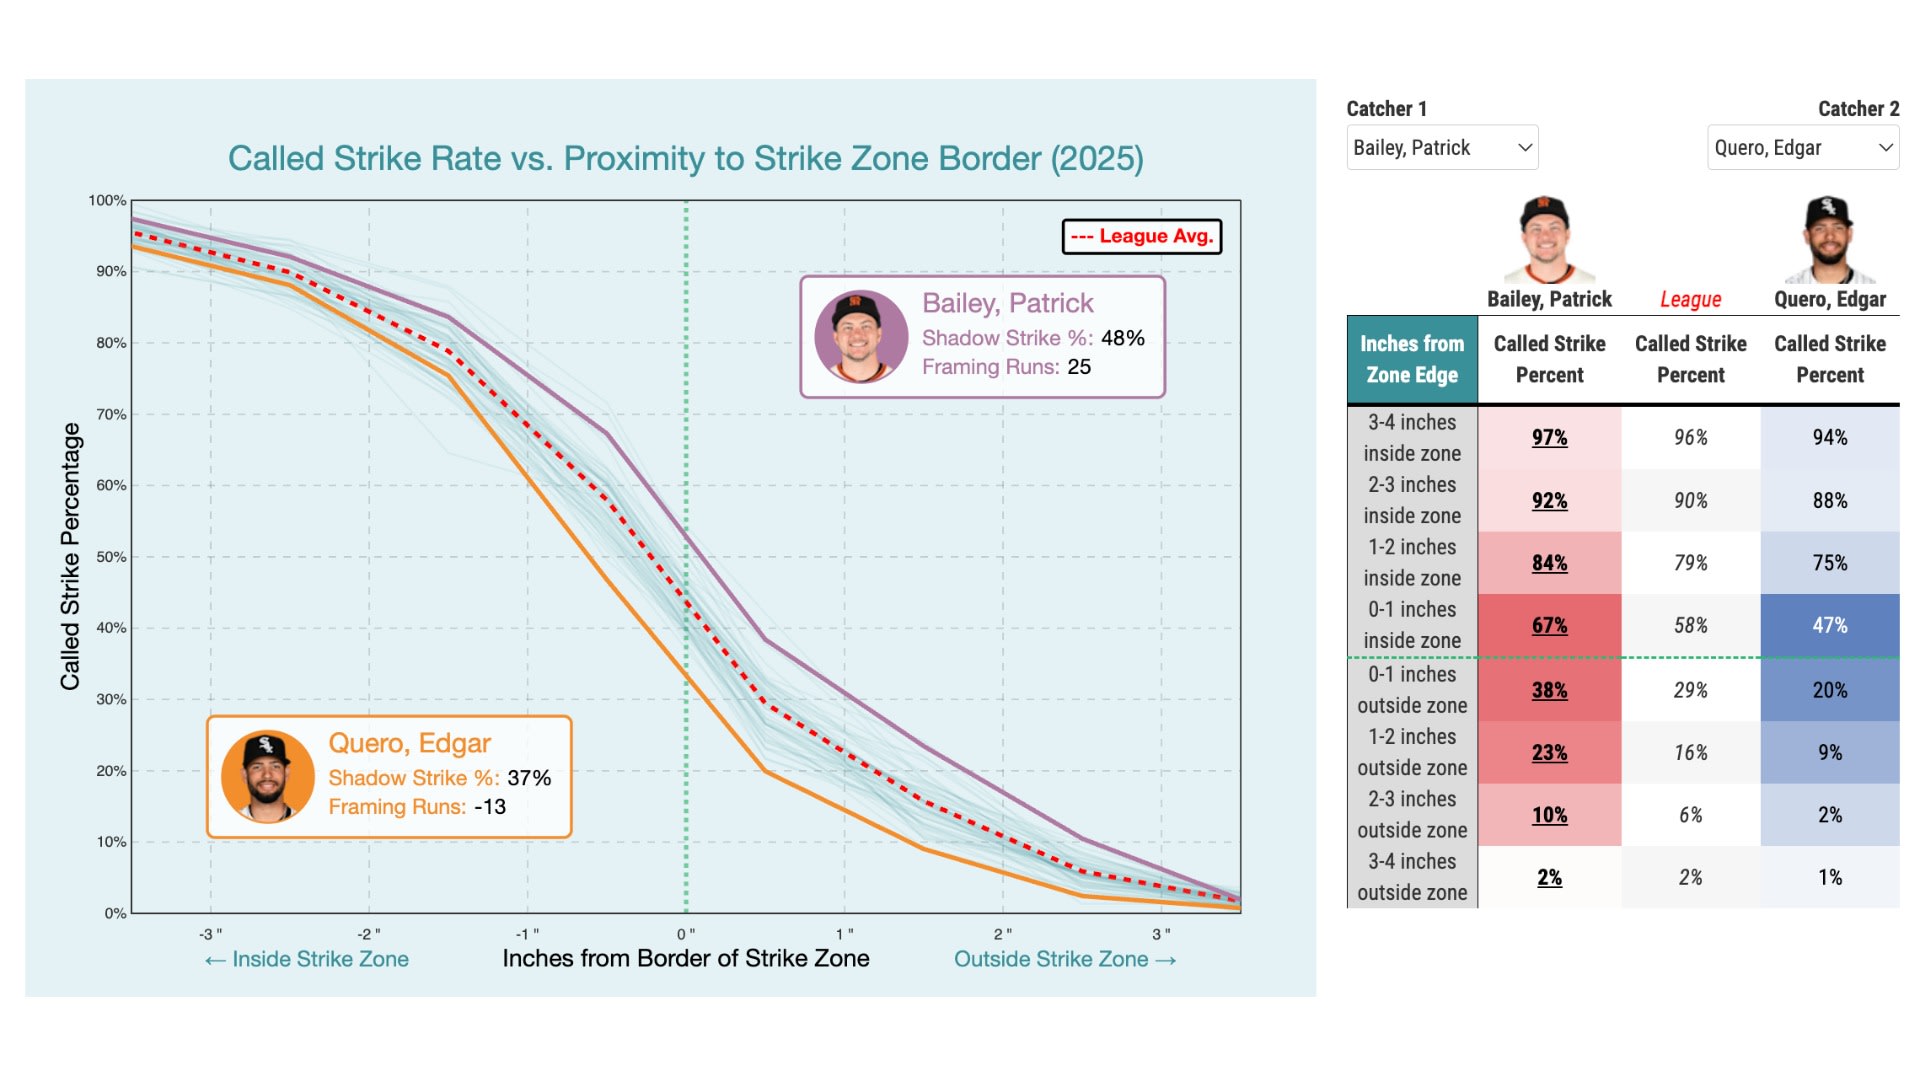
The difference between a top framing catcher and a bottom-tier framing catcher can be huge. For example, the Giants’ Patrick Bailey was the best framing catcher in 2025, with +25 runs saved via pitch framing. That helped make him the most valuable fielder in MLB overall for the season. Meanwhile, the worst framing catcher, Edgar Quero of the White Sox, had a -13 framing run value.
The Statcast framing leaderboard also displays complete breakdowns of all catchers’ called strike rates in each specific area – including the top, bottom, inside and outside edges of the zone, the four corners of the zone, the “heart” of the zone (pitches more than a baseball’s width inside the strike zone) and the “chase” and “waste” regions (pitches more than a baseball’s width outside the strike zone).
In 2025, the Statcast pitch framing model was updated to add a greater level of detail to how a catcher’s receiving skill is evaluated – including the called strike probability for each pitch based on its distance inside or outside the strike zone.
With the new leaderboard, you can now see each catcher’s most difficult called strikes gained (or easiest potential strikes lost to called balls) sorted by how far they are from the edges of the zone. The new data can also be filtered by month, pitcher hand, batter side, pitch type and more.
That updated catcher framing data is available back to the 2018 season. Catcher framing data is also available for the 2015-17 seasons, but only on a full-season level. Those seasons can be viewed here.
For the period from 2018-25, the best framing catchers in baseball include Austin Hedges (+72 catcher framing runs), Bailey (+65 framing runs), Yasmani Grandal (+60 framing runs), Jose Trevino (+51 framing runs), Christian Vázquez (+46 framing runs) and Cal Raleigh (+40 framing runs).
Statcast’s pitch framing data is also viewable from the pitcher’s perspective (the framing value provided by his catchers), the batter’s perspective (catchers’ framing impact while a batter is at the plate), and can also be grouped on the team and league level.