
Busch Stadium Financing Report
A Look at the Return on Investment
Economic Results: $545 Million to City and State & Over $5.2 Billion in Regional Impact
In late 2002 the St. Louis Cardinals, the City of St. Louis, the State of Missouri and St. Louis County reached an agreement on the financing of a new ballpark in downtown St. Louis. In an era when most sports facilities were built with a majority of public subsidies, the Cardinals deal was privately financed and involved little public money.
While the Cardinals covered nearly 90% of the costs of the entire project with private funds, the City provided relief from a local admissions tax on tickets and the State helped with public infrastructure costs to clear and prepare the site for development. Since 2005, the Cardinals have invested over $750 million in new construction in downtown St. Louis.
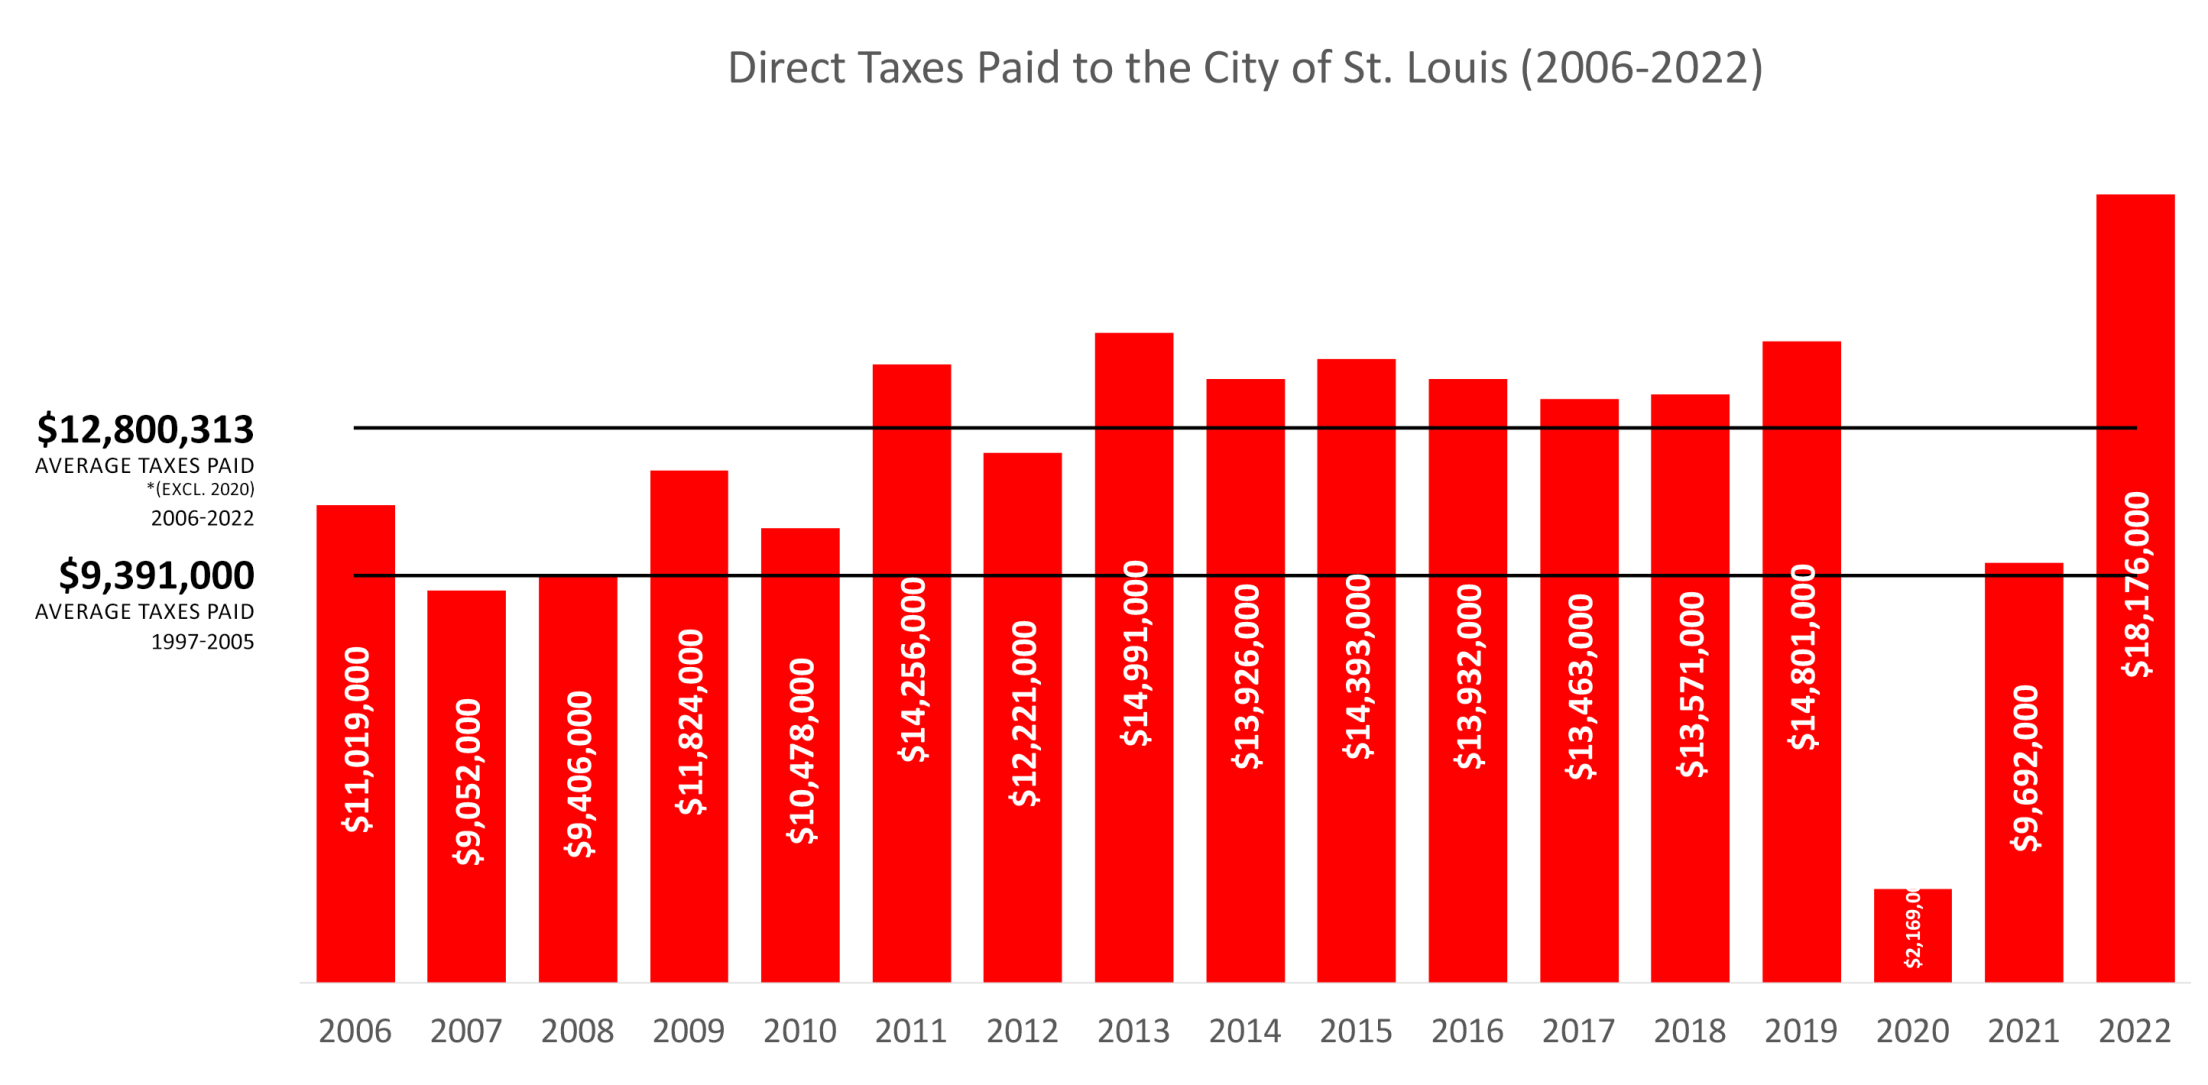
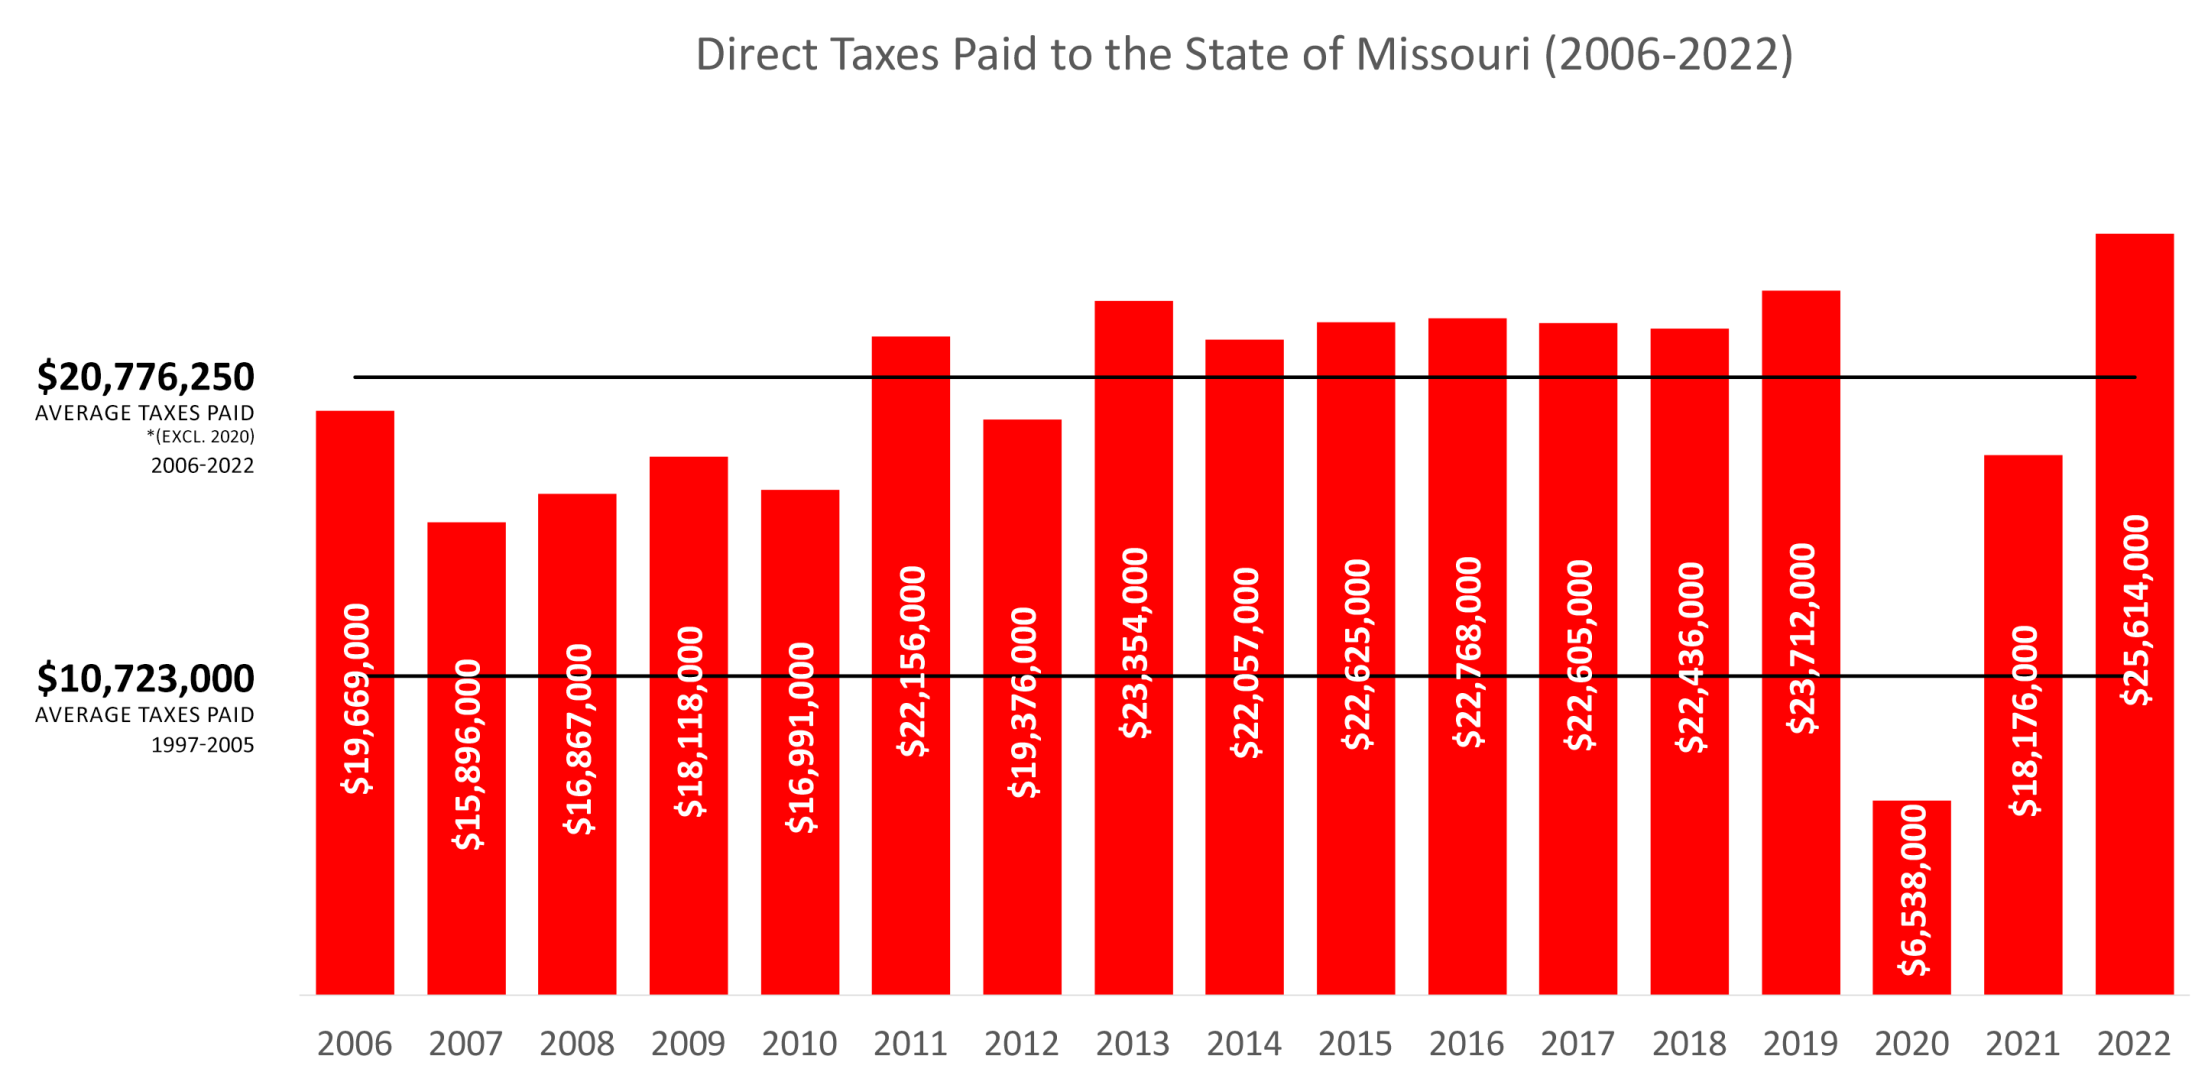
The tax revenue produced by the new ballpark to the City and State have exceeded expectations. The Cardinals and their affiliates have paid over $545 million in sales, income, real estate and other taxes to the City and State from 2006 through 2022.
The Cardinals have generated a tremendous amount of economic benefits for the region as well. According to Greater St. Louis Inc., the estimated direct and indirect economic impact of the Cardinals' 18 seasons from 2006 through 2023 totals over $5.2 billion in output for the St. Louis region, with out-of-town visitors constituting approximately 35% of annual fan attendance.
(Click to Enlarge)
(Click to Enlarge)
Direct Tax Revenues to the City and State from Busch Stadium
| 2006 | 2007 | 2008 | 2009 | 2010 | |
|---|---|---|---|---|---|
| City | $11,019,000 | $9,052,000 | $9,406,000 | $11,824,000 | $10,478,000 |
| State | $19,669,000 | $15,896,000 | $16,867,000 | $18,118,000 | $16,991,000 |
| Total | $30,688,000 | $24,948,000 | $26,273,000 | $29,924,000 | $27,469,000 |
| 2011 | 2012 | 2013 | 2014 | 2015 | |
|---|---|---|---|---|---|
| City | $14,256,000 | $12,221,000 | $14,991,000 | $13,926,000 | $14,393,000 |
| State | $22,156,000 | $19,376,000 | $23,354,000 | $22,057,000 | $22,625,000 |
| Total | $36,412,000 | $31,597,000 | $38,345,000 | $35,983,000 | $37,018,000 |
| 2016 | 2017 | 2018 | 2019 | 2020 | |
|---|---|---|---|---|---|
| City | $13,932,000 | $13,463,000 | $13,571,000 | $14,801,000 | $2,169,000 |
| State | $22,768,000 | $22,605,000 | $22,436,000 | $23,712,000 | $6,538,000 |
| Total | $36,700,000 | $36,068,000 | $36,007,000 | $38,513,000 | $8,707,000 |
| 2021 | 2022 | Total | Average* | |
|---|---|---|---|---|
| City | $9,692,000 | $17,780,000 | $206,974,000 | $12,800,313 |
| State | $18,176,000 | $25,614,000 | $338,958,000 | $20,776,250 |
| Total | $27,868,000 | $43,394,000 | $545,932,000 | $33,576,563 |
* excludes 2020